Copyright
©2008 The WJG Press and Baishideng.
World J Gastroenterol. Jan 14, 2008; 14(2): 224-230
Published online Jan 14, 2008. doi: 10.3748/wjg.14.224
Published online Jan 14, 2008. doi: 10.3748/wjg.14.224
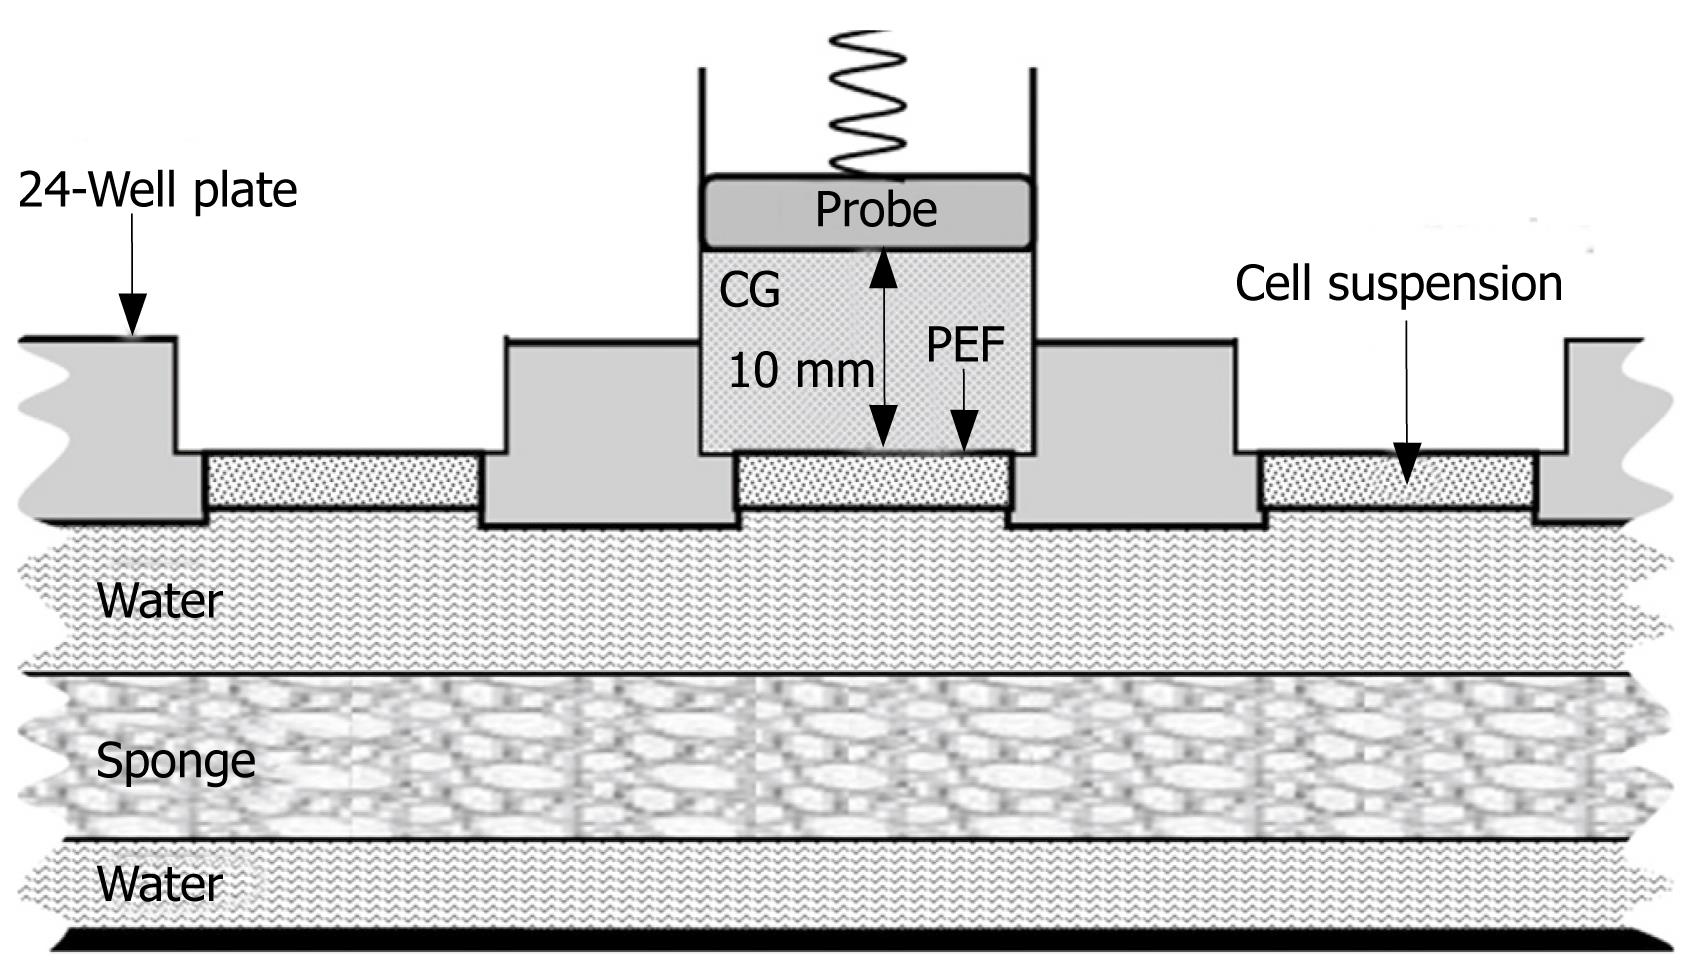
Figure 1 Schematic diagram of gene transfection.
Transducer with contact gel (CG) was placed on the cell suspension covered with a 6-&mgr;m poly-ester film (PEF) under 1.9 MHz continuous ultrasound with a 80.0 mW/cm2 output intensity. The 24-well plate was kept in a water bath at 37°C, and a sponge mat was placed in the water bath.
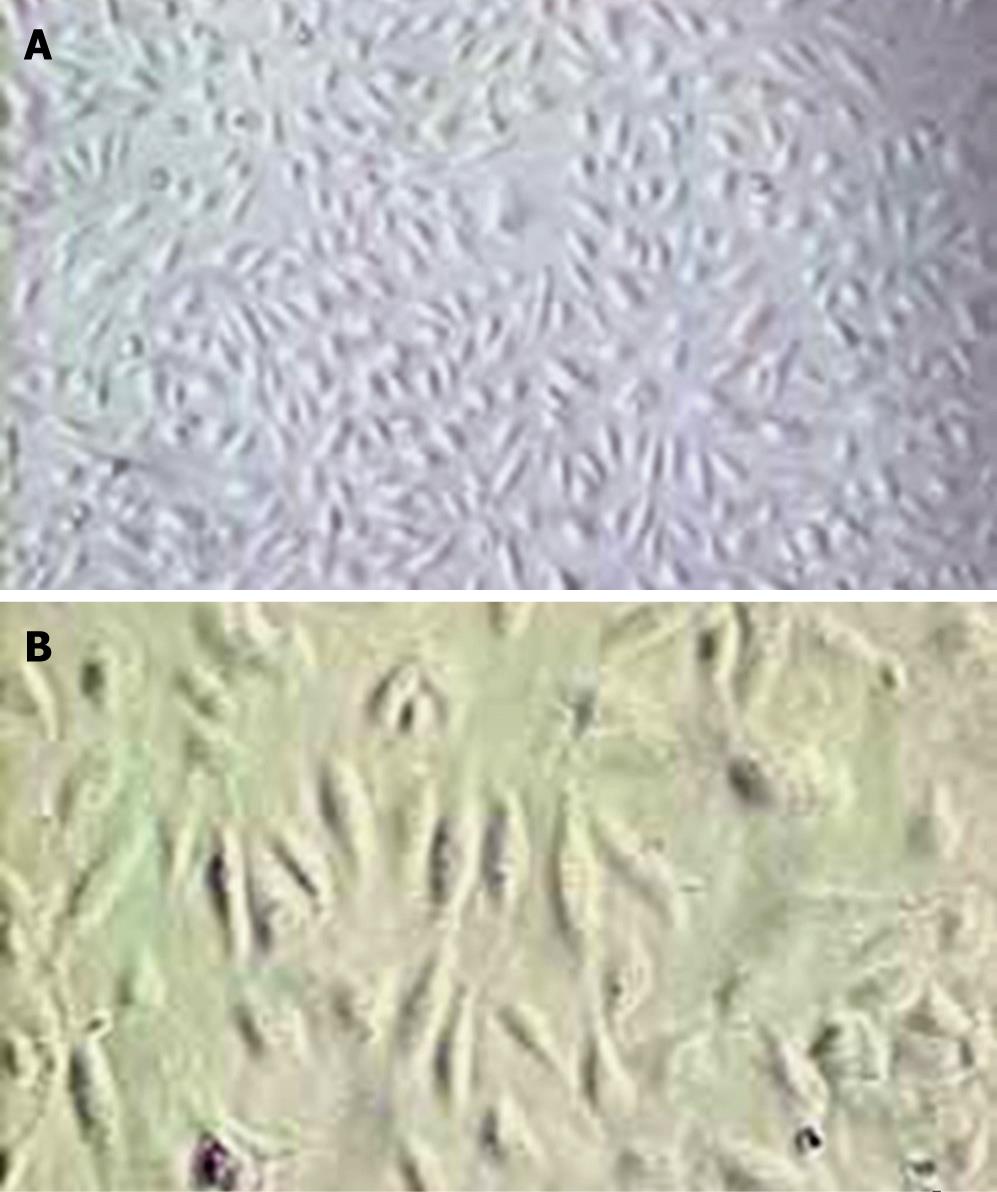
Figure 2 Photomicrographs show cultured human endothelial cells on d 7.
The cells appeared to be a monolayer of very flat, polygonal-shaped cells. A: × 100; B: × 200.
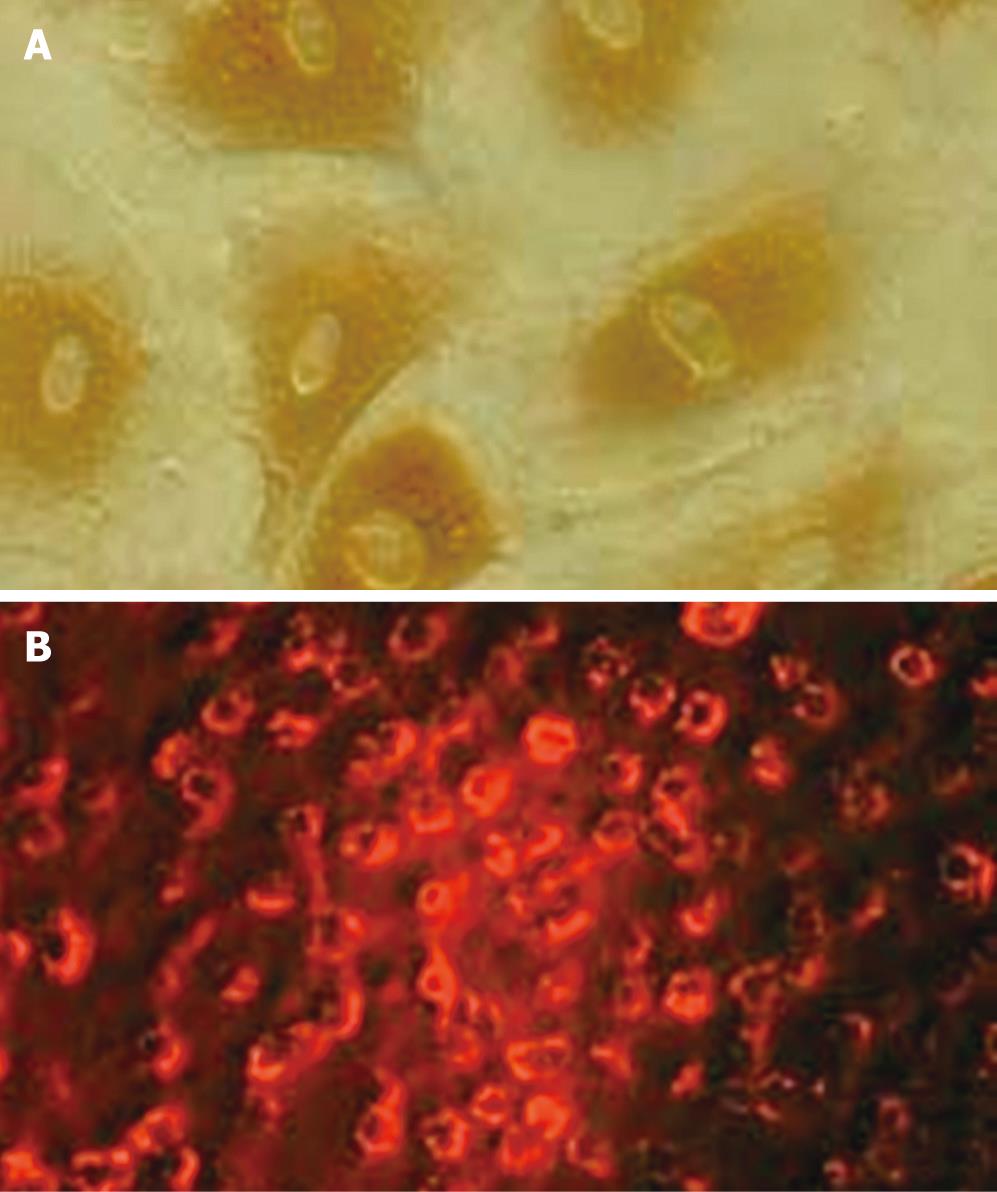
Figure 3 Immunofluorescence study of cultured human endothelial cells.
A: Shows immunofluorescence positive-stained cells treated with Factor VIII related antigen. The cells were stained brown (× 400); B: Shows positive-stained cells in vitro treated with DiI-Ac-LDL. More than 95% HUVECs are found to be red fluorescence (× 400).
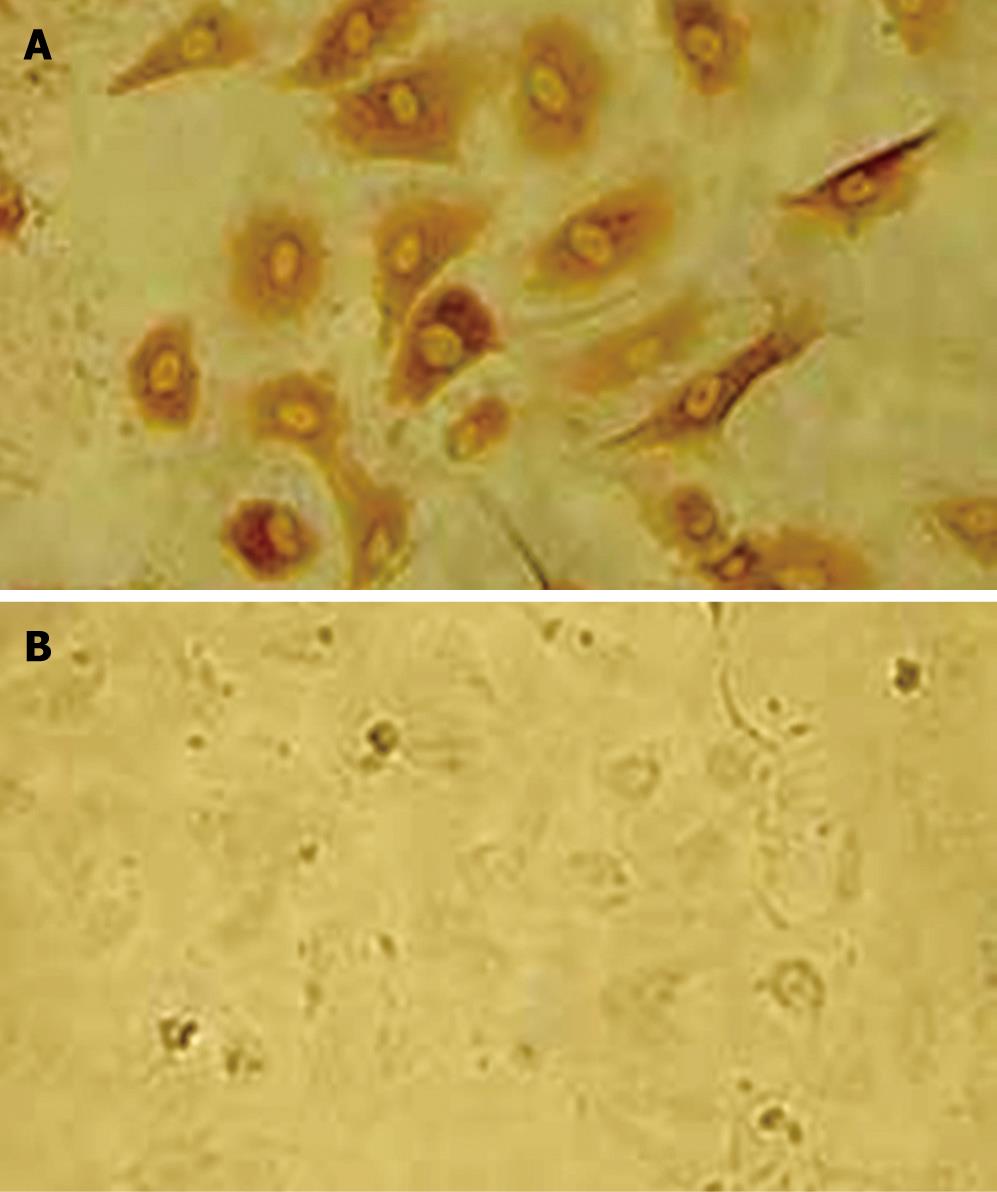
Figure 4 Immunofluorescence study (× 400) of cultured human endothelial cells.
A: Shows positive-stained human endothelial cells with KDR receptor; B: Shows negative-stained human hepatoma cells without KDR receptor.
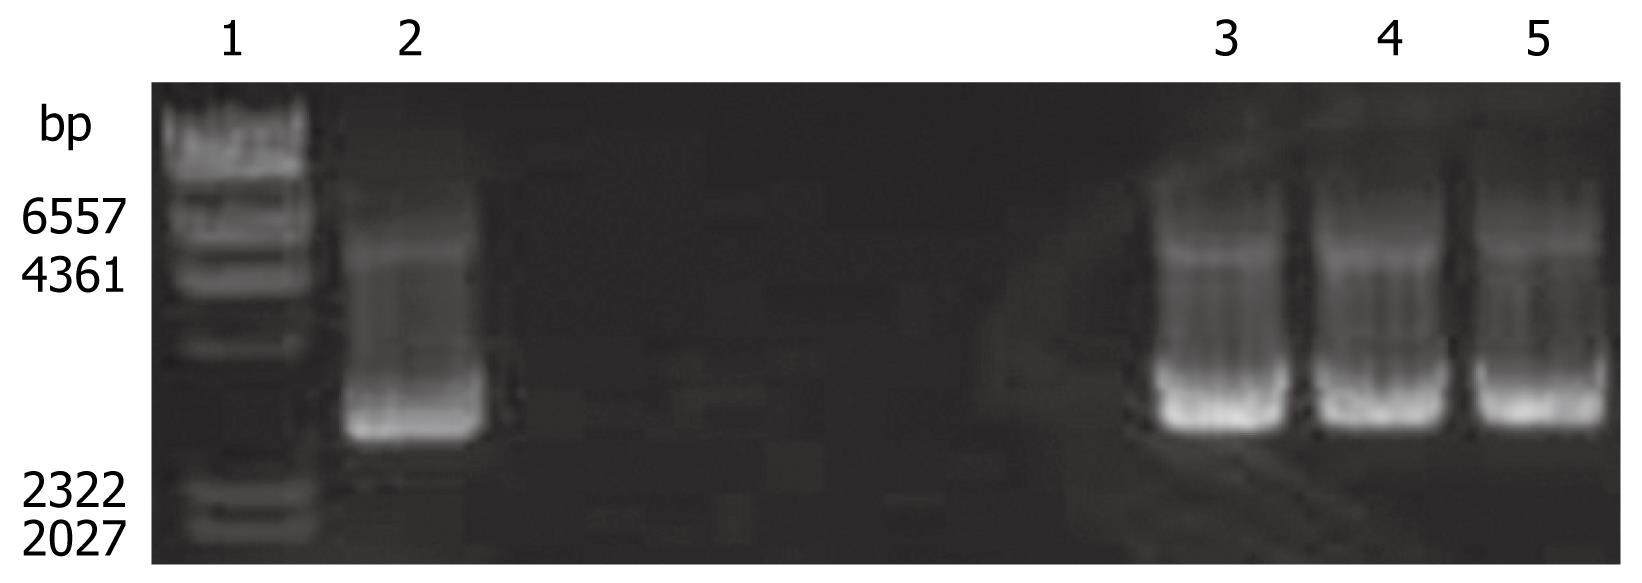
Figure 5 Identification of recombinant pEGFP-KDR-TK by restriction enzyme digestion (SalI/XhoI) and electrophoresis.
Lane 1: DNA markers (λDNA/HindIII); Lane 2-5: pEGFP-KDR-TK was digested with SalI/ XhoI.
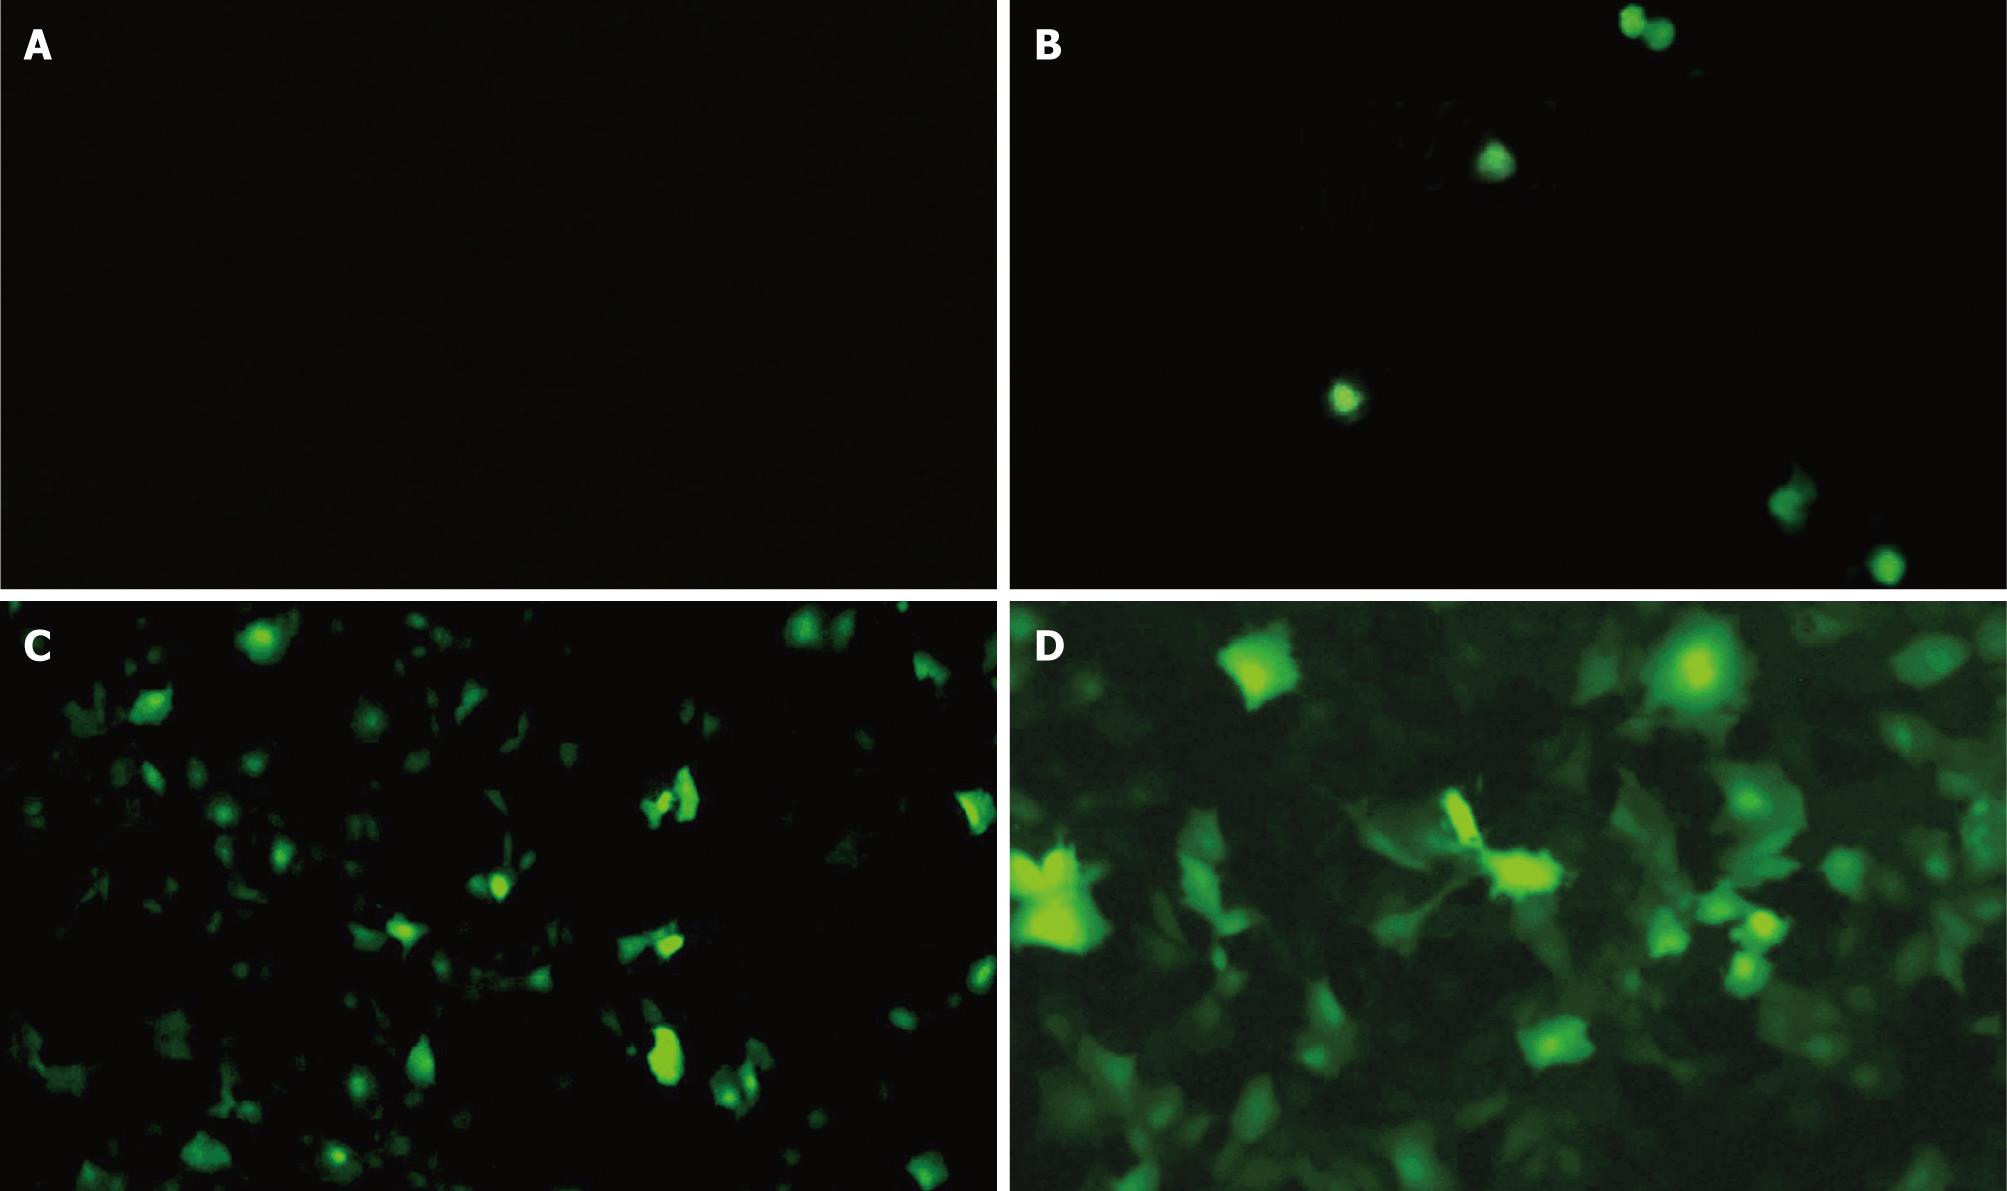
Figure 6 Fluorescent microscopy showed EGFP expression 48 h after pEGFP-KDR-TK transfection.
A: Shows no obvious EGFP expression in cells without microbubbles and ultrasound (× 200); B: 1.7% cells exposed to ultrasound only shows EGFP expression (× 200); C, D: Significant increase in EGFP expression in HUVECs exposed to both the ultrasound and SonoVue (C: × 200, D: × 400). About 20.3% HUVECs had EGFP expression.
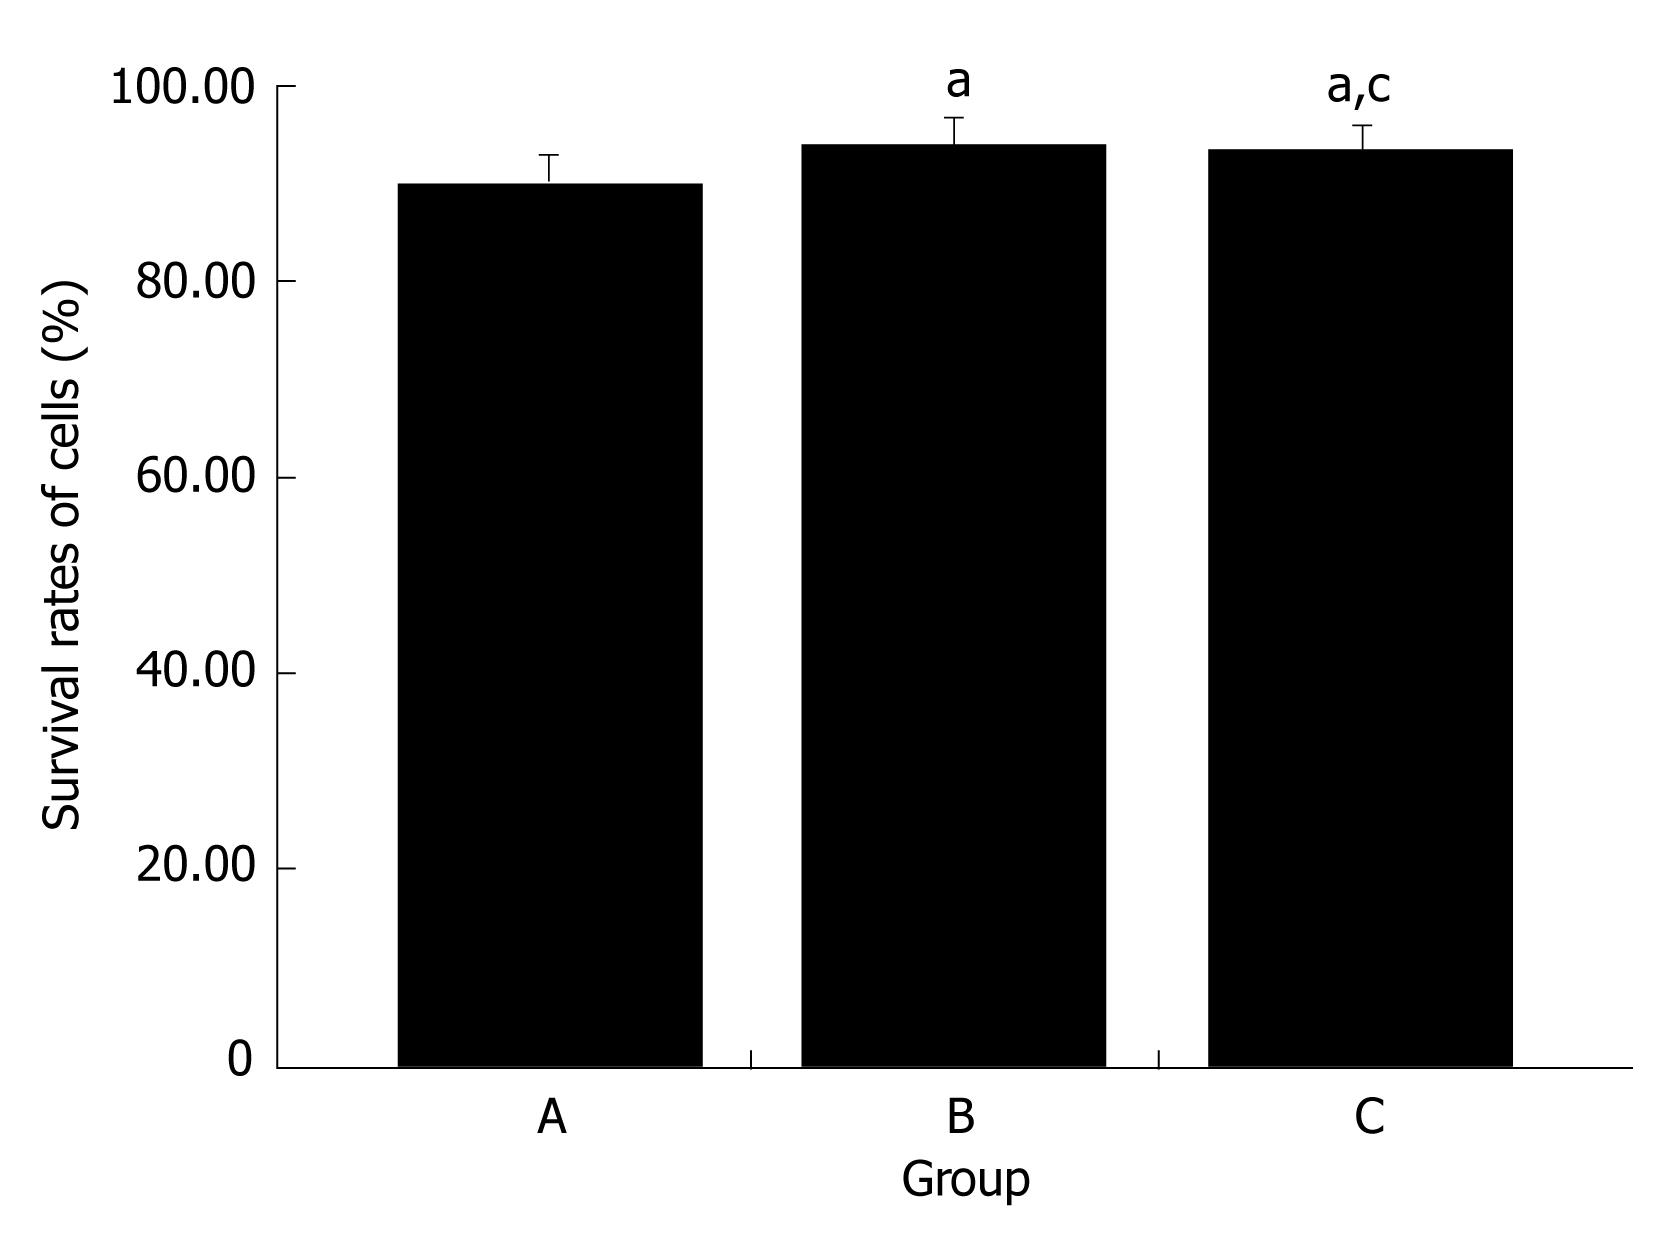
Figure 7 HUVECs survival rate examined by trypan blue dye exclusion after transfection.
Values are expressed as the average percentage of viable cells, n = 5 from 3 independent experiments. aP < 0.05 vs group A; cP > 0.05 vs group B.
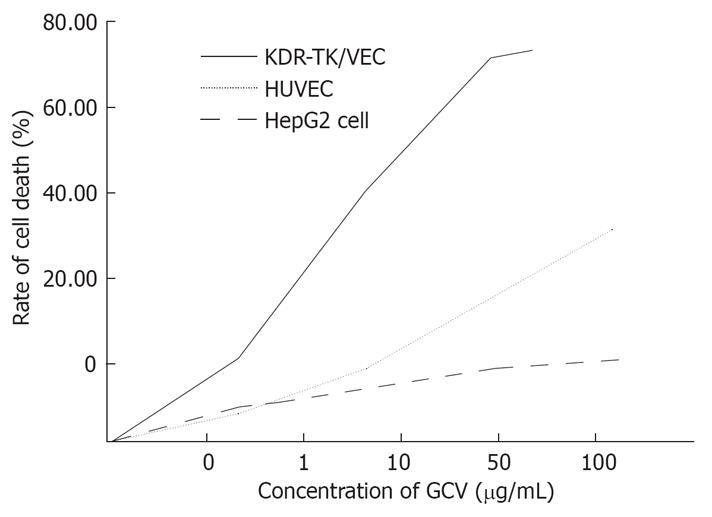
Figure 8 In vitro cytotoxic effect of GCV on KDR-TK transfected HUVECs (KDR-TK/VEC), non-transfected HUVECs, and HepG2 cells.
KDR-TK/VECs, non-transfected HUVECs, and HepG2 cells were cultured with various concentrations of GCV for 3 d and viability was estimated by MTT assay.
- Citation: Wang Y, Xu HX, Lu MD, Tang Q. Expression of thymidine kinase mediated by a novel non-viral delivery system under the control of vascular endothelial growth factor receptor 2 promoter selectively kills human umbilical vein endothelial cells. World J Gastroenterol 2008; 14(2): 224-230
- URL: https://www.wjgnet.com/1007-9327/full/v14/i2/224.htm
- DOI: https://dx.doi.org/10.3748/wjg.14.224


