Copyright
©2008 The WJG Press and Baishideng.
World J Gastroenterol. May 21, 2008; 14(19): 3015-3020
Published online May 21, 2008. doi: 10.3748/wjg.14.3015
Published online May 21, 2008. doi: 10.3748/wjg.14.3015
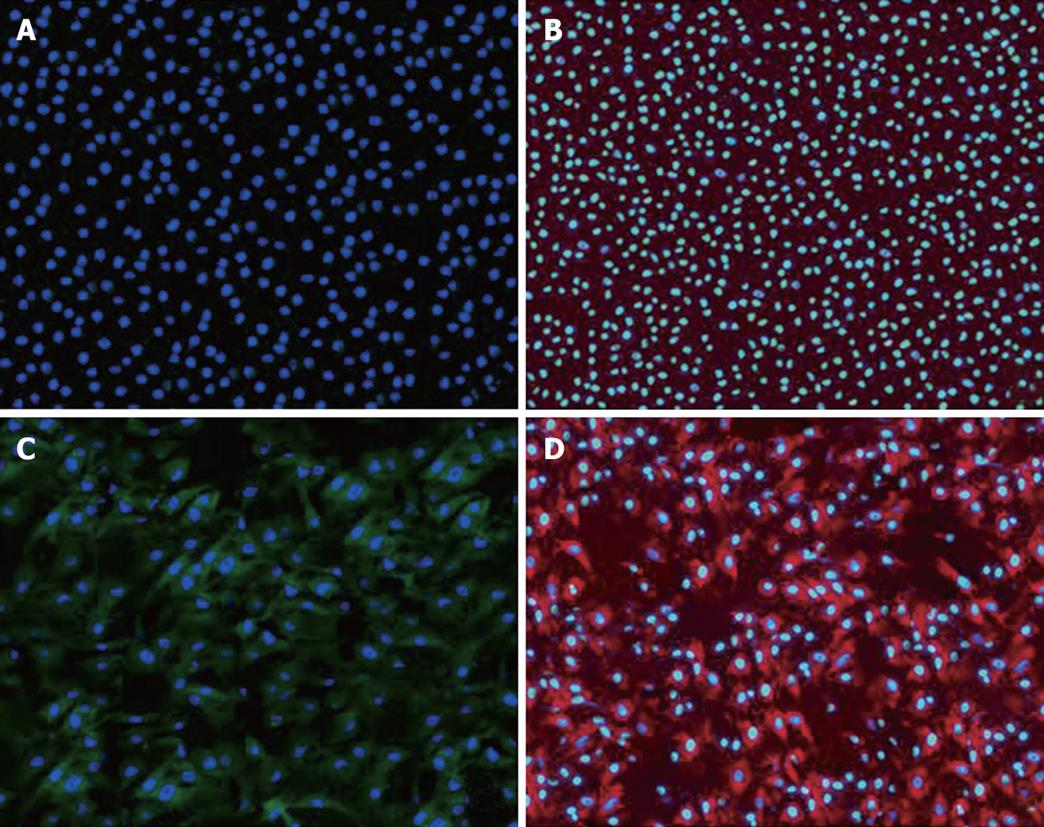
Figure 1 Immunofluorescence of α-fetoprotein and albumin in bone marrow stromal cells, with or without treatment of HGF in culture (× 400).
A: α-fetoprotein expression was negative in the absence of HGF; B: Albumin expression was negative in the absence of HGF; C: α-fetoprotein expression localized at the cytoplasm in hepatocyte-like BMSCs; D: Albumin expression localized at the cytoplasm in hepatocyte-like BMSCs.
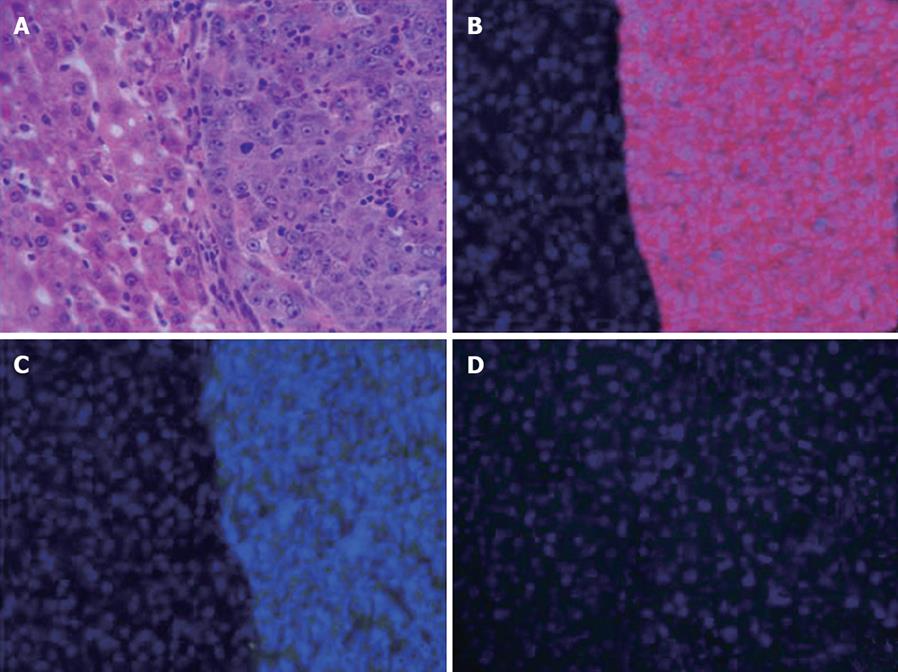
Figure 2 Histopathological analysis of the tumors in the liver serial sections of recipient mice after 6 mo of DEN treatment (× 400).
A: HCC nodules development at 6 mo stained with haematoxylineosin; B: HCC expressing GST-P appeared as red fluorescence by immunofluorescence; C: HCC expressing α-fetoprotein appeared as green fluorescence by immunofluorescence; D: HCC was negative for cytokeratin 19 by immunofluorescence.
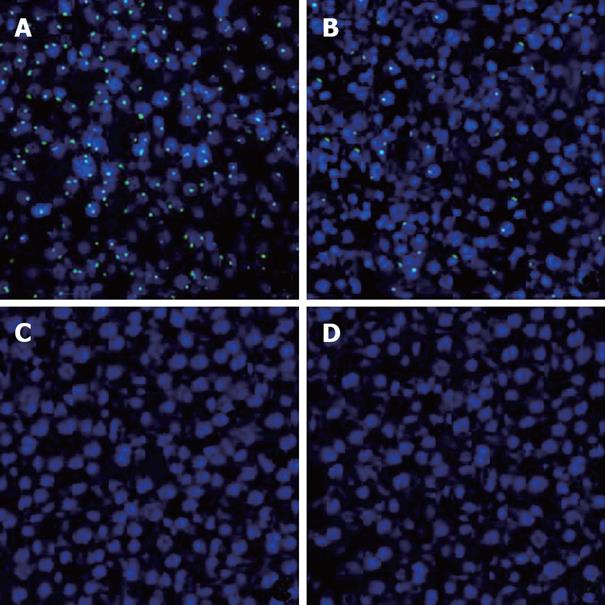
Figure 3 Repopulation and carcinogenesis of male bone marrow-derived cells in female recipient liver tissues by FISH for Y chromosome (× 400).
A: normal male liver, positive Y-chromosome signals appeared as green dots in the nuclei stained with DAPI, a chromosomal marker that appears as blue fluorescence; B: Six months after BMSCs transplantation and DEN treatment, some of hepatocyte nuclei were positive for the Y chromosome in the liver of female recipients; C: Six months after BMSCs transplantation without DEN treatment, none of hepatocyte nuclei was positive for Y chromosome in the liver of female recipients; D: HCC was negative for Y chromosome in nucleus.
- Citation: Zheng JF, Liang LJ. Transplanted bone marrow stromal cells are not cellular origin of hepatocellular carcinomas in a mouse model of carcinogenesis. World J Gastroenterol 2008; 14(19): 3015-3020
- URL: https://www.wjgnet.com/1007-9327/full/v14/i19/3015.htm
- DOI: https://dx.doi.org/10.3748/wjg.14.3015


