Copyright
©2008 The WJG Press and Baishideng.
World J Gastroenterol. Apr 28, 2008; 14(16): 2501-2510
Published online Apr 28, 2008. doi: 10.3748/wjg.14.2501
Published online Apr 28, 2008. doi: 10.3748/wjg.14.2501
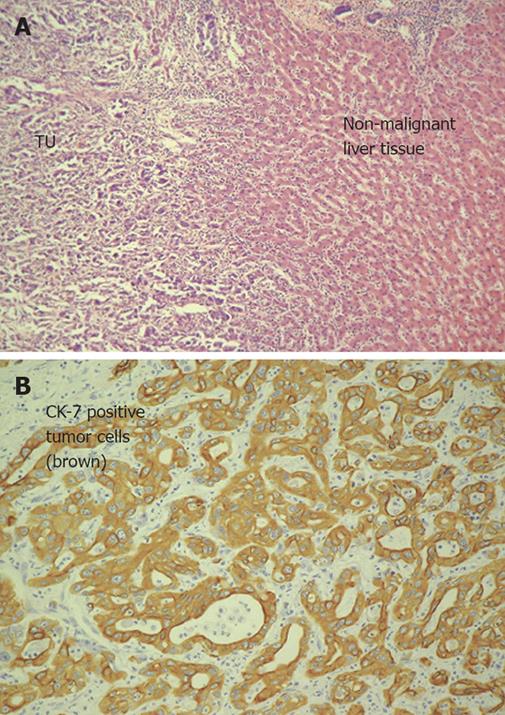
Figure 1 A: HE staining of infiltrative intrahepatic cholangiocarcinoma (Patient No.
6; left tumor tissue with cells of a moderate (G2) differentiated adenocarcinoma, right non-malignant liver tissue); B: Detection of cytokeratin 7 in intrahepatic cholangiocarcinoma (same patient as in A) using immunohistochemistry. Cytokeratin 7 was detected in over 80% of all analyzed CCCs strongly overexpressed (14.6-fold change).
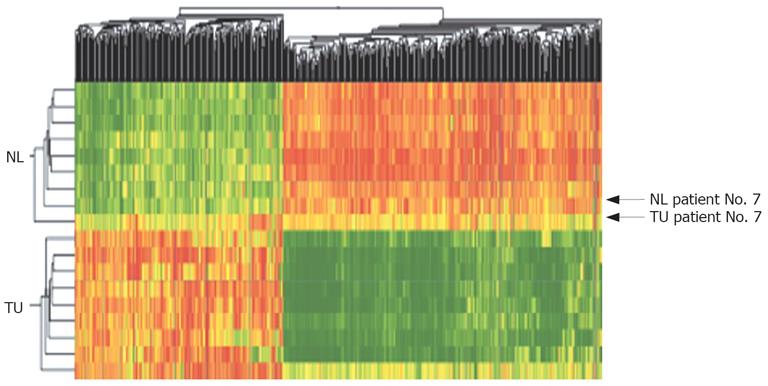
Figure 2 Two-dimensional cluster analysis of CCC (TU) and corresponding non-malignant liver tissues (NL) using 552 dysregulated genes/ESTs (red: overexpressed genes, green: downregulated genes; Pearson’s correlation).
Dysregulation was defined as different genetic expression in > 70% of all probes with a fold change > 2.0. Horizontal lines show all dysregulated genes in one singular tissue probe, vertical lines show the expression of one gene in all analyzed tumor and non-malignant tissue probes. Using cluster analysis a fast differentiation between tumor tissue and non-malignant tissue was possible in 90% of cases (tumor tissue of Patient No. 7 showed many genetic similarities to non-malignant liver tissue).
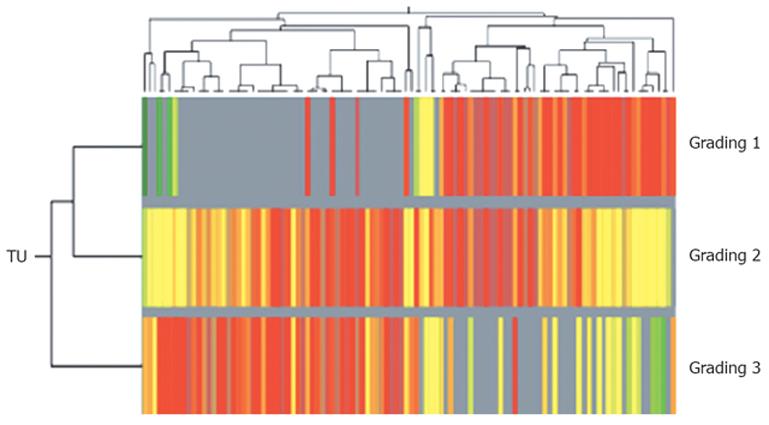
Figure 3 Subclassification of intrahepatic CCC using two-dimensional cluster analysis of 136 different regulated genes/ESTs (dysregulation in more than 70% of all probes, fold change of genetic expression > 2.
0; Pearson's correlation) in relation to histopathological findings (well to poor differentiated tumor tissue). Horizontal lines show all dysregulated genes in one singular tumor tissue probe, vertical lines show the expression of one gene in all analyzed G1-, G2- and G3-tumors. Overexpressed genes are coloured red, downregulated genes are shown in green).
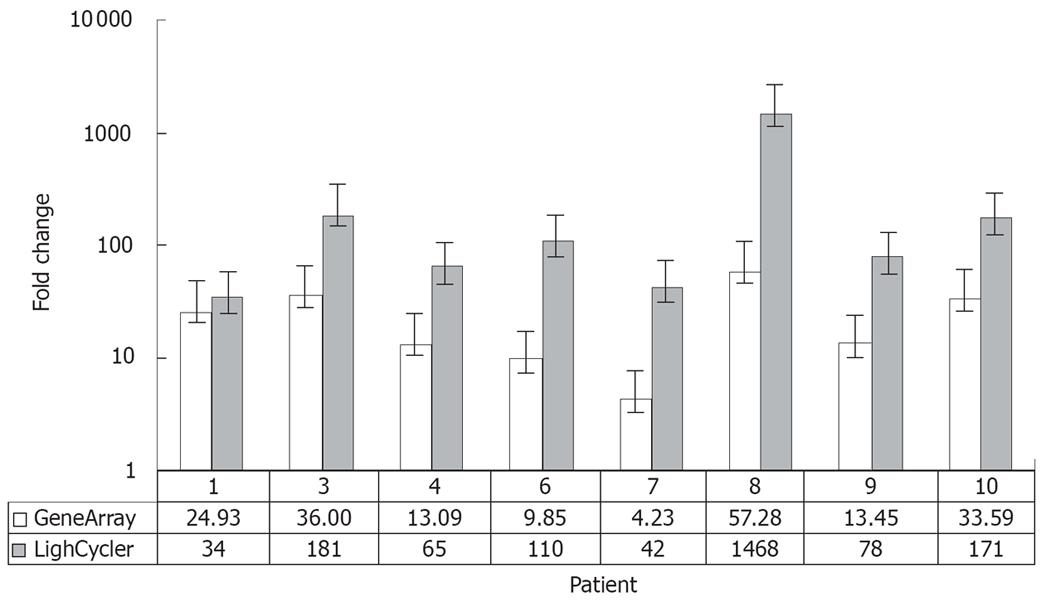
Figure 4 Comparison between expression values of osteopontin in 8 intrahepatic CCCs estimated by RT-PCR (LightCycler®System; grey) and gene expression data (HU 133A, Affymetrix; white).
The detected changes in osteopontin expression levels measured by RT-PCR reflected very well the changes in gene expression between tumor and non-malignant liver tissue obtained by microarray analysis. The results of RT-PCR revealed larger changes than the microarray data in all cases.
- Citation: Hass HG, Nehls O, Jobst J, Frilling A, Vogel U, Kaiser S. Identification of osteopontin as the most consistently over-expressed gene in intrahepatic cholangiocarcinoma: Detection by oligonucleotide microarray and real-time PCR analysis. World J Gastroenterol 2008; 14(16): 2501-2510
- URL: https://www.wjgnet.com/1007-9327/full/v14/i16/2501.htm
- DOI: https://dx.doi.org/10.3748/wjg.14.2501


