Copyright
©2008 The WJG Press and Baishideng.
World J Gastroenterol. Apr 14, 2008; 14(14): 2179-2186
Published online Apr 14, 2008. doi: 10.3748/wjg.14.2179
Published online Apr 14, 2008. doi: 10.3748/wjg.14.2179
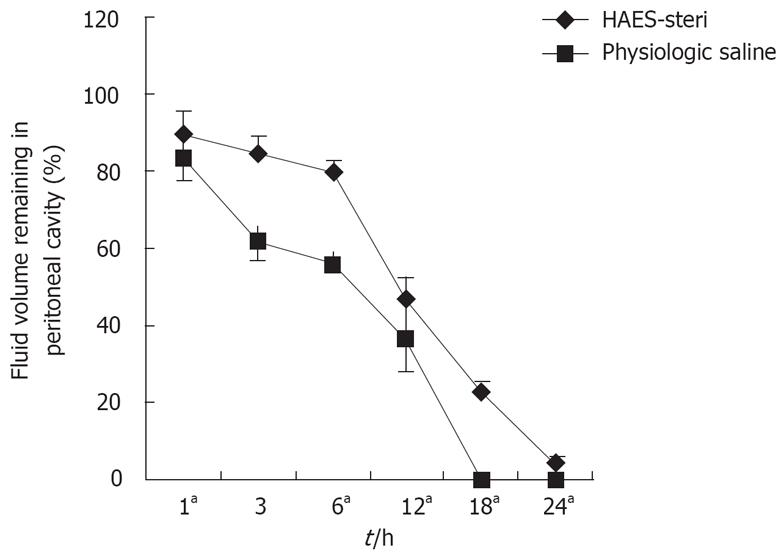
Figure 1 Mean peritoneal fluid volume remaining as a percentage of initial chemotherapy solution volume administered (aP < 0.
05 between the two carrier solutions).
Figure 2 Mean peritoneal fluid concentration of 5-fluorouracil with different carrier solutions (aP < 0.
05 between the two carrier solutions).
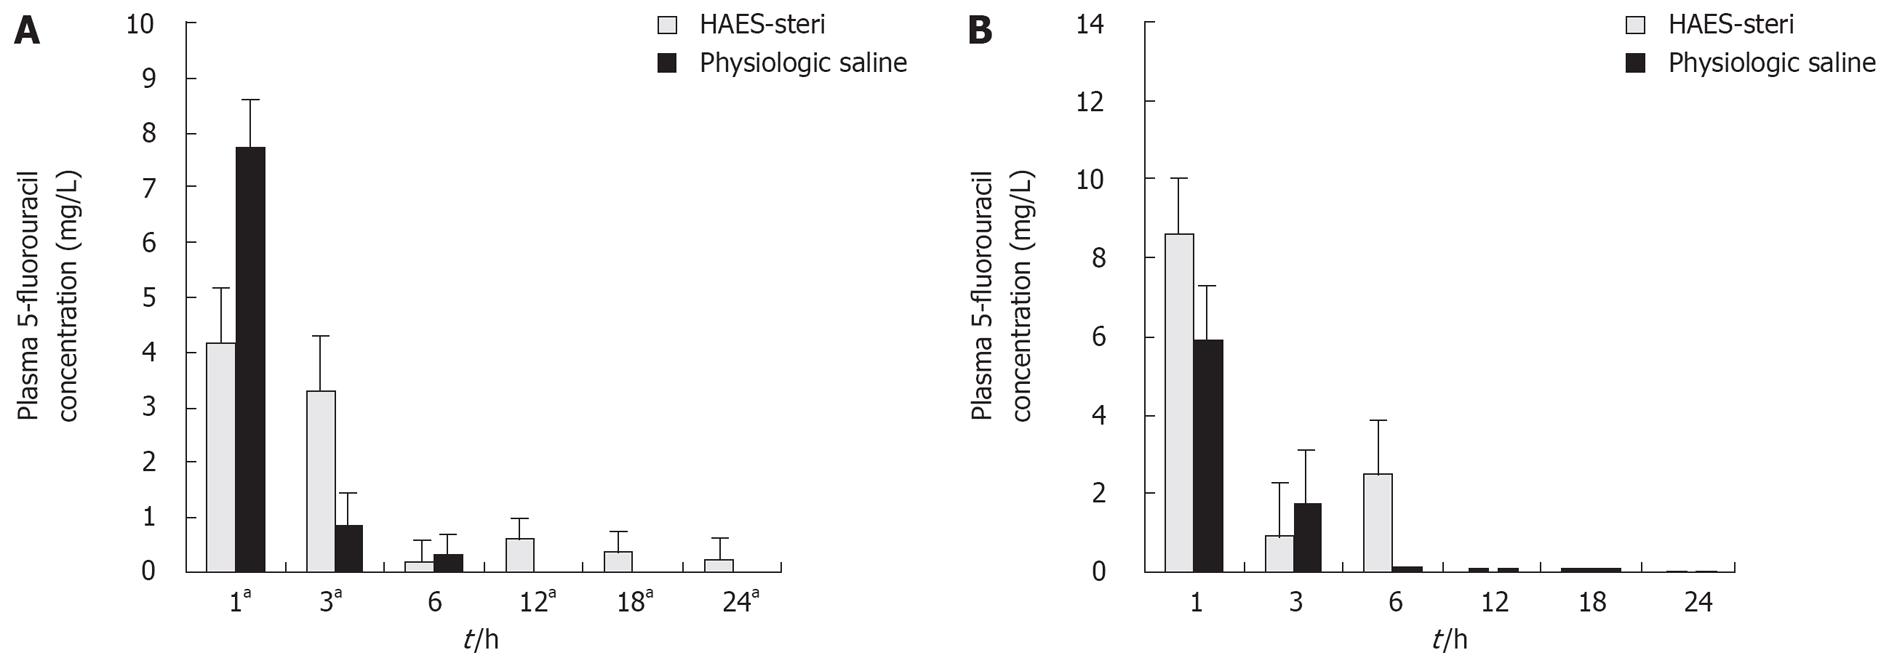
Figure 3 A: Mean plasma concentration of 5-fluorouracil in portal vein with different carrier solutions (aP < 0.
05 between the two carrier solutions); B: Mean plasma concentration of 5-fluorouracil in inferior caval vein with different carrier solutions.
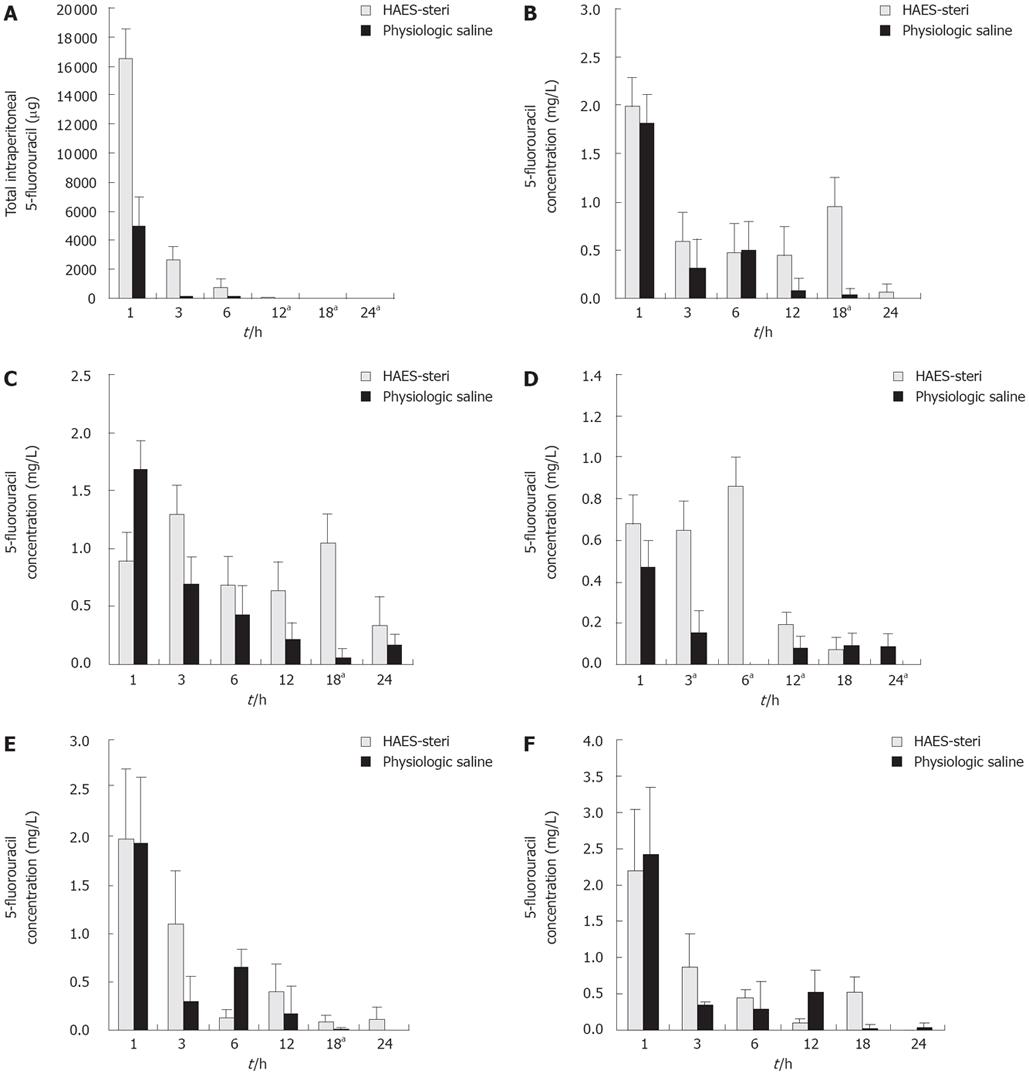
Figure 4 A: Mean total quantity of 5-fluorouracil in peritoneal fluid with different carrier solutions (aP < 0.
05 between the two carrier solutions); B: 5-fluorouracil concentration in gastric tissue with different carrier solutions (aP < 0.05 between the two carrier solutions); C: 5-fluorouracil concentration in colon tissue with different carrier solutions (aP < 0.05 between the two carrier solutions); D: 5-fluorouracil concentration in liver tissue with different carrier solutions (aP < 0.05 between the two carrier solutions); E: 5-fluorouracil concentration in lung tissue with different carrier solutions (aP < 0.05 between the two carrier solutions); F: 5-fluorouracil concentration in renal tissue with different carrier solutions (aP < 0.05 between the two carrier solutions).
- Citation: Wei ZG, Li GX, Huang XC, Zhen L, Yu J, Deng HJ, Qing SH, Zhang C. Pharmacokinetics and tissue distribution of intraperitoneal 5-fluorouracil with a novel carrier solution in rats. World J Gastroenterol 2008; 14(14): 2179-2186
- URL: https://www.wjgnet.com/1007-9327/full/v14/i14/2179.htm
- DOI: https://dx.doi.org/10.3748/wjg.14.2179


