Copyright
©2008 The WJG Press and Baishideng.
World J Gastroenterol. Apr 7, 2008; 14(13): 2049-2054
Published online Apr 7, 2008. doi: 10.3748/wjg.14.2049
Published online Apr 7, 2008. doi: 10.3748/wjg.14.2049
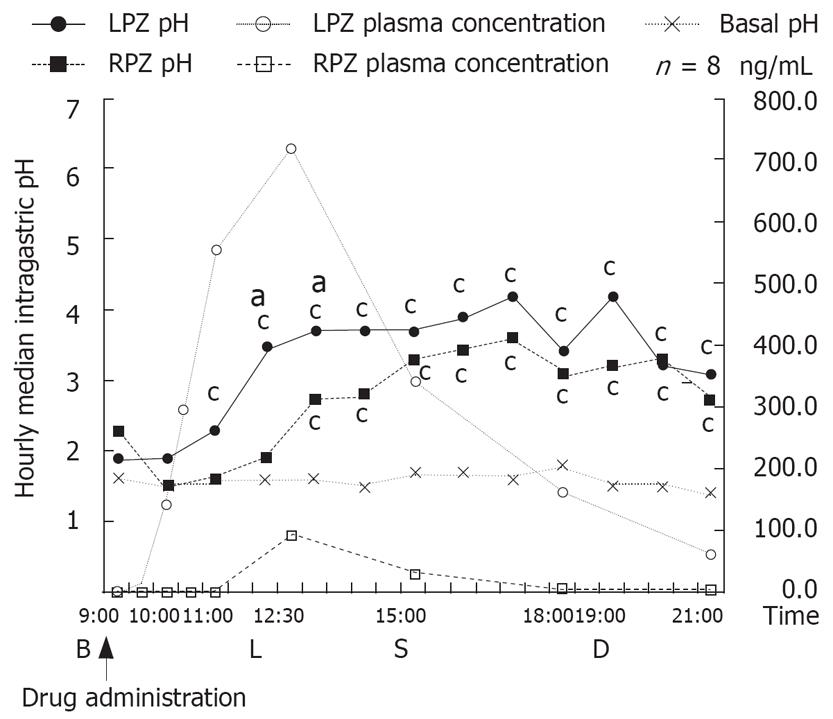
Figure 1 The 12-h (median pH per hour) trendgrams for all subjects (n = 8) and correlations with the blood concentration of each drug.
The solid line (•) shows hourly intragastric median pH of individuals administered LPZ 30 mg OD, and the broken line (▪) shows that of individuals administered RPZ. The solid line (◦) shows the blood drug concentration level in individuals administered LPZ OD 30 mg, and the broken line (▫) shows those in individuals administered RPZ 10 mg tablets. The solid line (×) shows the intragastric pH values of all subjects obtained without medication. LPZ 30 mg OD induces an earlier rise in both blood concentration level and median pH than RPZ 10 mg tablets. Arrows: Drug administration. B: Breakfast, L: Lunch, S: Snacks, D: Dinner. Blood sample were collected 1, 1.5, 2, 3.5, 6, 9 and 12 h after the administration of each drug. The significance of differences in these intragastric pHs among each regimen was determined by the Wilcoxon signed rank test. aP < 0.05 vs RPZ; cP < 0.05 vs baseline data.
- Citation: Yamagishi H, Koike T, Ohara S, Horii T, Kikuchi R, Kobayashi S, Abe Y, Iijima K, Imatani A, Suzuki K, Hishinuma T, Goto J, Shimosegawa T. Early effects of Lansoprazole orally disintegrating tablets on intragastric pH in CYP2C19 extensive metabolizers. World J Gastroenterol 2008; 14(13): 2049-2054
- URL: https://www.wjgnet.com/1007-9327/full/v14/i13/2049.htm
- DOI: https://dx.doi.org/10.3748/wjg.14.2049


