Copyright
©2008 The WJG Press and Baishideng.
World J Gastroenterol. Apr 7, 2008; 14(13): 1990-1996
Published online Apr 7, 2008. doi: 10.3748/wjg.14.1990
Published online Apr 7, 2008. doi: 10.3748/wjg.14.1990
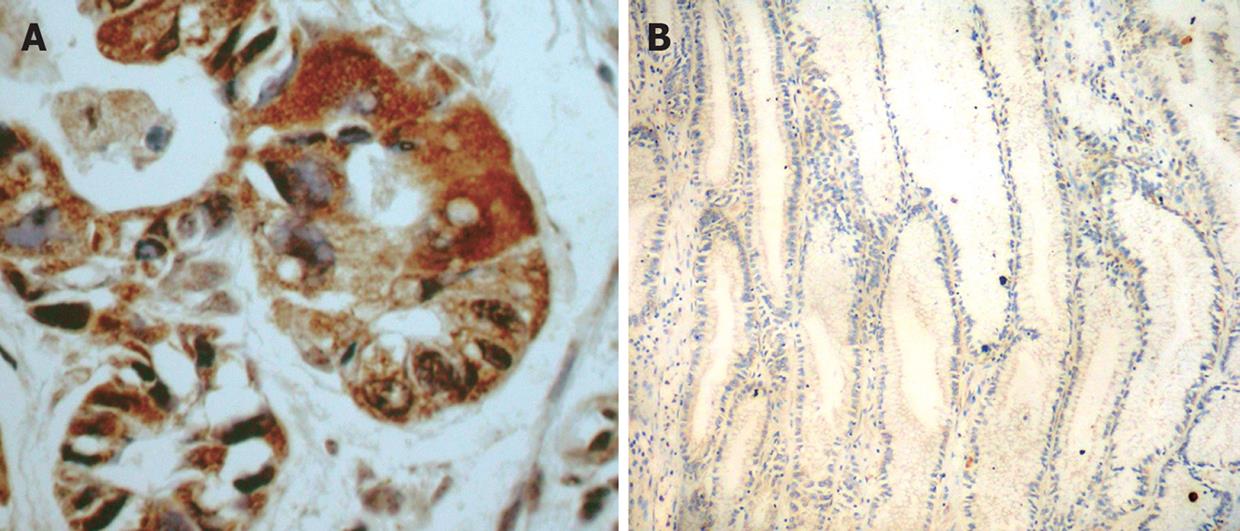
Figure 1 Syndecan-1 expression.
A: Syndecan-1 was negatively (+) expressed in gastric carcinoma. Sp method. (× 250); B: Syndecan-1 was highly expressed (++) in non-tumor gastric mucosa (× 250).
Figure 2 E-cadherin expressions.
A: E-cadherin was negatively (+) expressed in gastric carcinoma (Magnification × 250); B: E-cadherin was highly expressed (++) in non-tumor gastric mucosa (× 250).
Figure 3 Integrin β3 expression.
A: Integrin β3 was highly expressed (+++) in gastric carcinoma (× 250); B: Integrin β3 was negatively (+) expressed in non-tumor gastric mucosa (× 250).
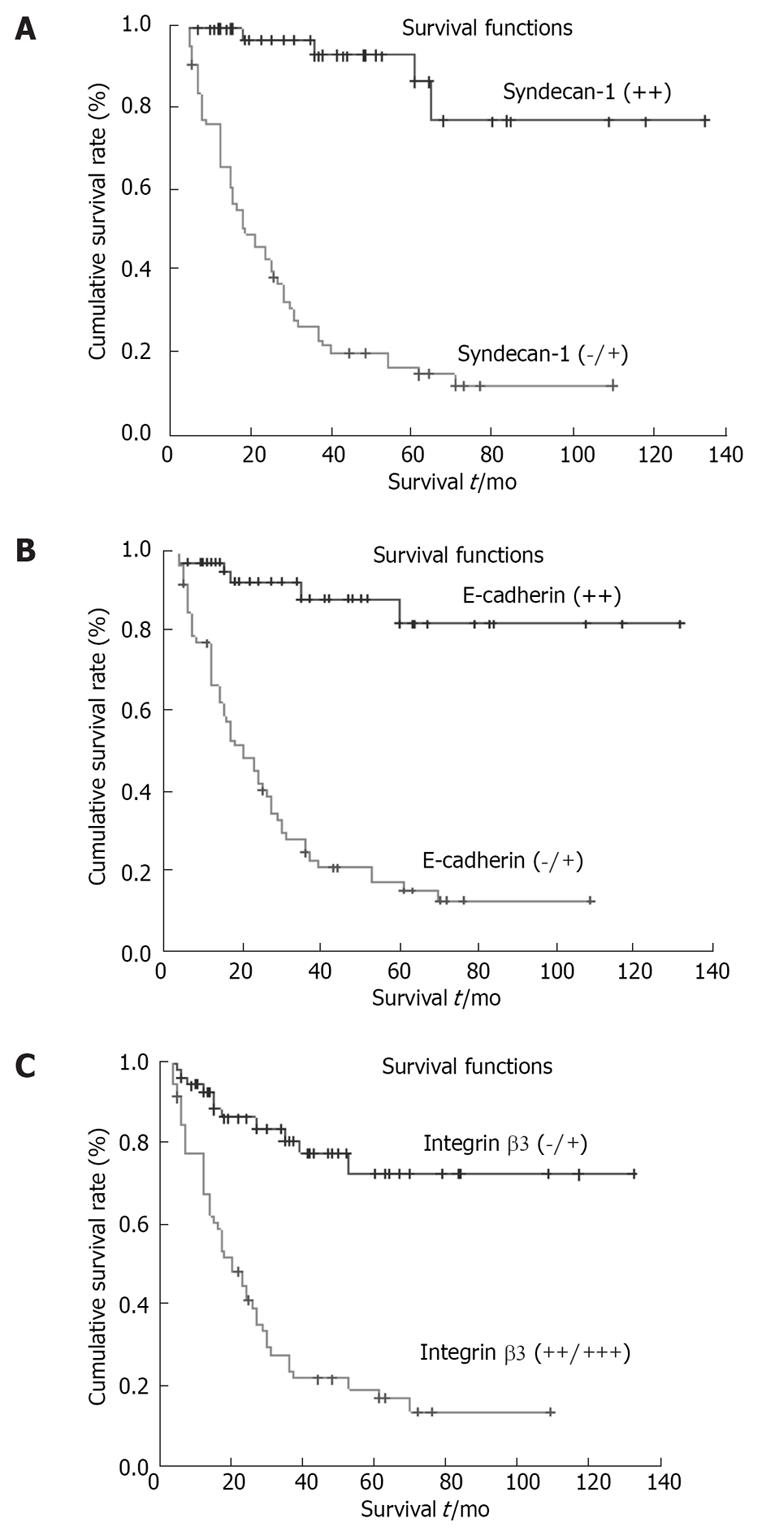
Figure 4 Correlation between syndecan-1, E-cadherin and integrin β3 expressions and the survival time.
A: Survival curves by the Kaplan-Meier method. Long-rank test revealing a significant difference between negative and positive expression of Syndecan-1 (P < 0.05); B: Survival curves by Kaplan-Meier method. Long-rank test revealing a significant difference between negative and positive expression of E-cadherin (P < 0.05); C: Survival curves by the Kaplan-Meier method. There was a significant difference in Long-rank test between positive and negative expression of integrin β3 (P < 0.05).
- Citation: Chu YQ, Ye ZY, Tao HQ, Wang YY, Zhao ZS. Relationship between cell adhesion molecules expression and the biological behavior of gastric carcinoma. World J Gastroenterol 2008; 14(13): 1990-1996
- URL: https://www.wjgnet.com/1007-9327/full/v14/i13/1990.htm
- DOI: https://dx.doi.org/10.3748/wjg.14.1990


