Copyright
©2008 The WJG Press and Baishideng.
World J Gastroenterol. Mar 14, 2008; 14(10): 1479-1490
Published online Mar 14, 2008. doi: 10.3748/wjg.14.1479
Published online Mar 14, 2008. doi: 10.3748/wjg.14.1479
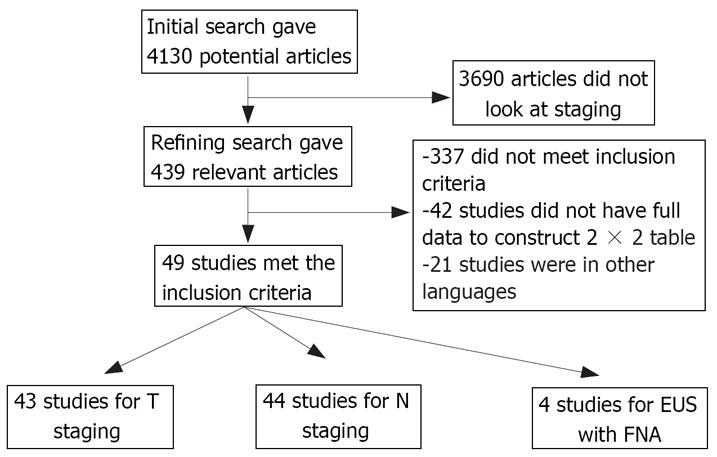
Figure 1 Search results.
Figure 2 A: Forrest plot showing sensitivity and specificity of EUS to diagnose T1 stage of esophageal cancer; B: Forrest plot showing sensitivity and specificity of EUS to diagnose T2 stage of esophageal cancer; C: Forrest plot showing sensitivity and specificity of EUS to diagnose T3 stage of esophageal cancer; D: Forrest plot showing sensitivity and specificity of EUS to diagnose T4 stage of esophageal cancer; E: Forrest plot showing sensitivity of EUS alone and EUS with FNA for N staging of esophageal cancer; F: Forrest plot showing specificity of EUS alone and EUS with FNA for N staging of esophageal cancer.
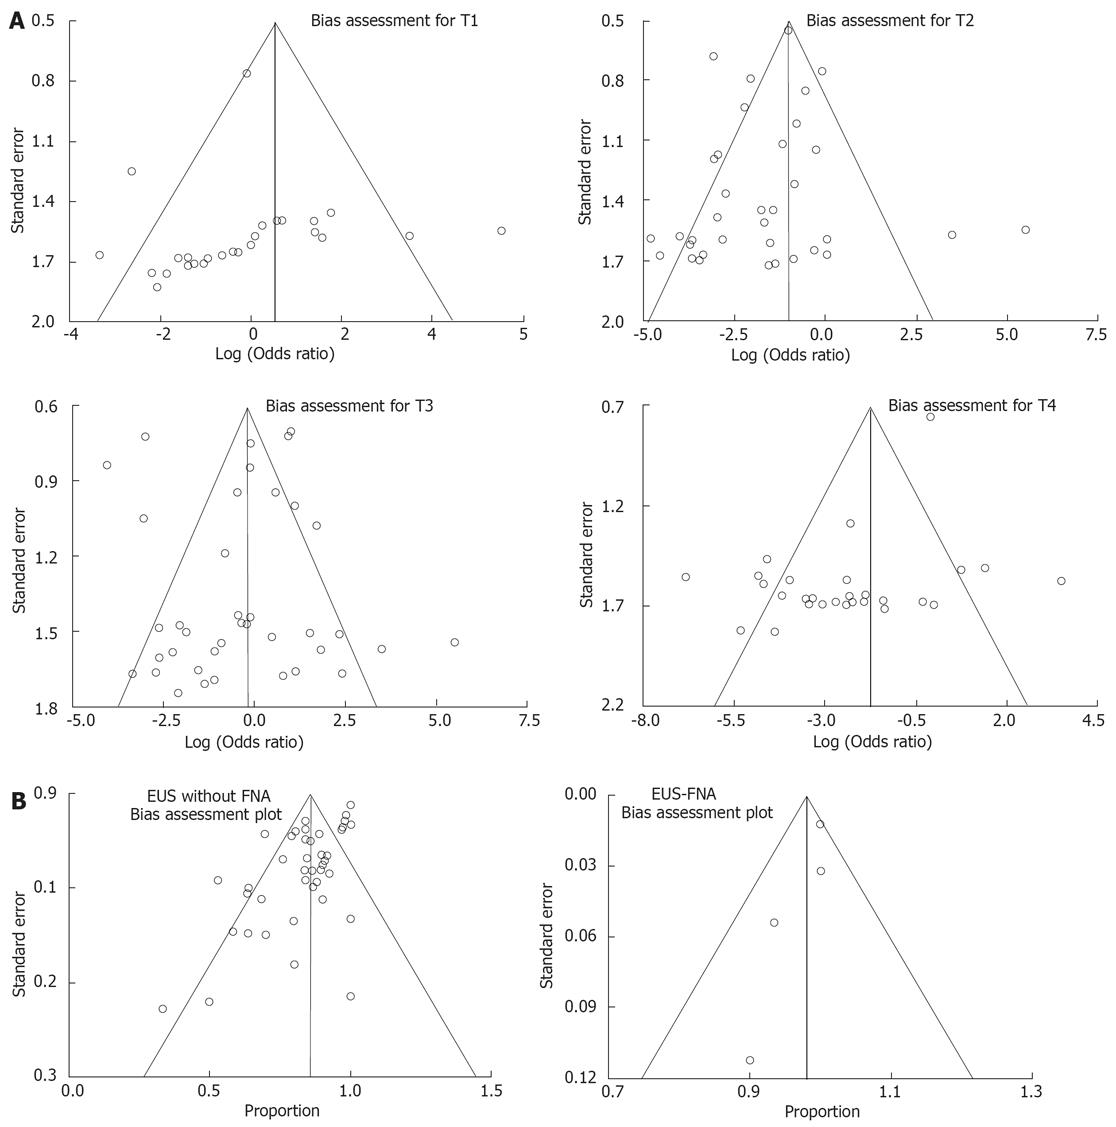
Figure 3 A: Funnel plots assessing bias for T staging; B: Funnel plots assessing bias for N staging.
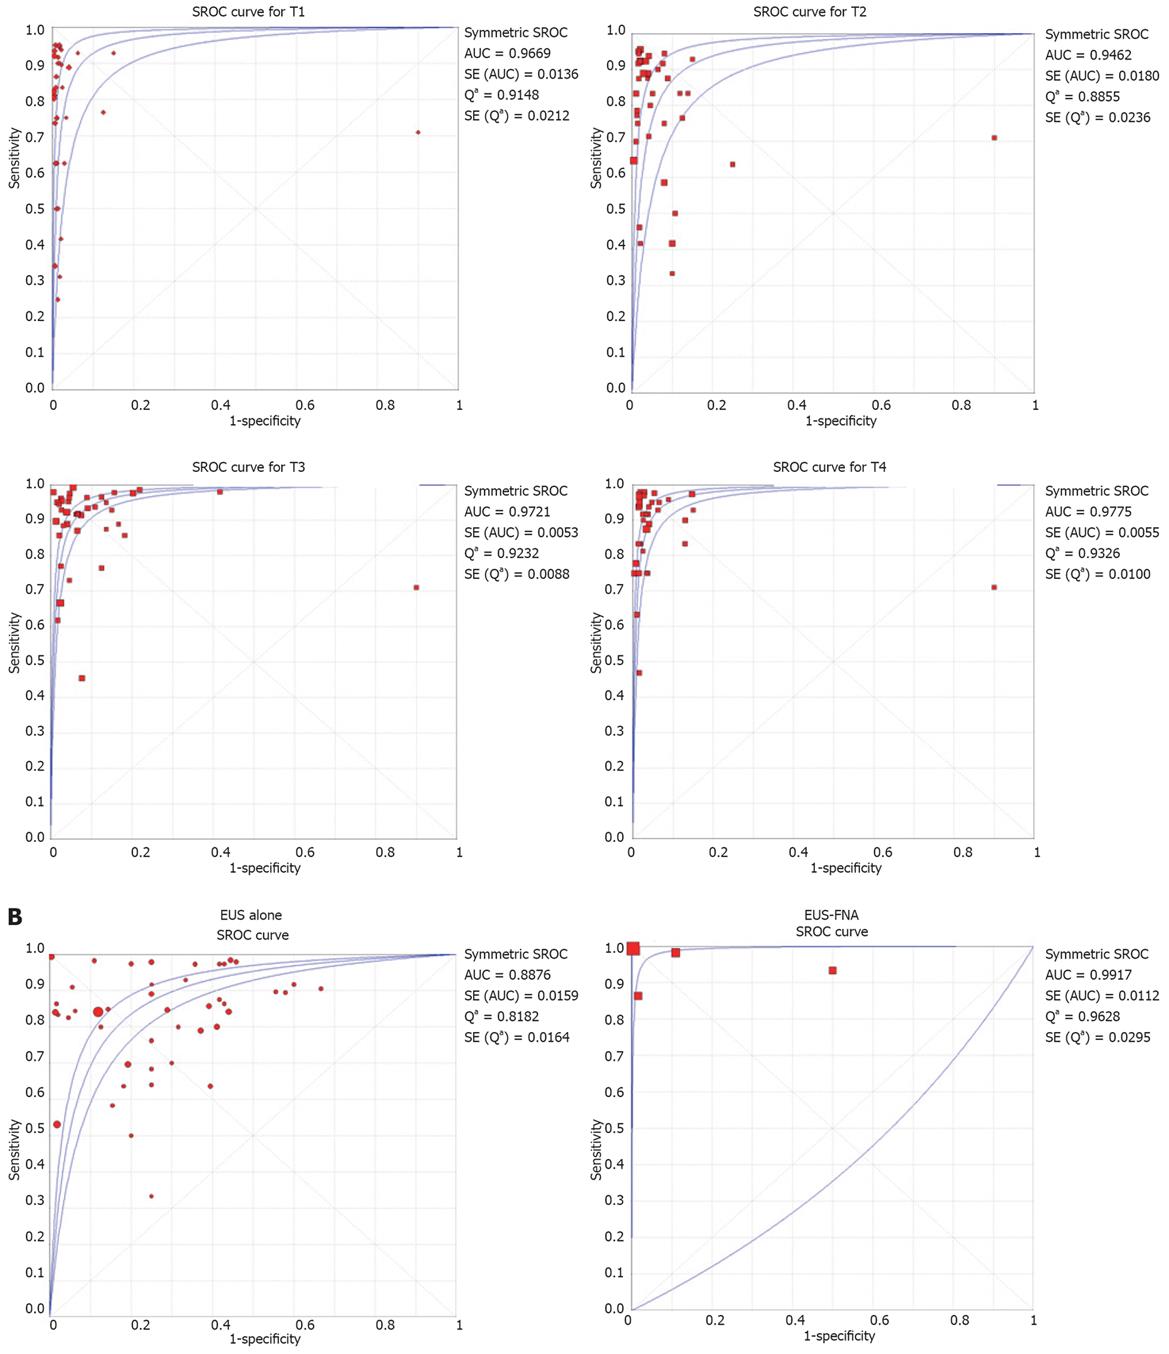
Figure 4 A: SROC curves for various T stages of esophageal cancer; B: SROC curves for various N stages of esophageal cancer.
- Citation: Puli SR, Reddy JB, Bechtold ML, Antillon D, Ibdah JA, Antillon MR. Staging accuracy of esophageal cancer by endoscopic ultrasound: A meta-analysis and systematic review. World J Gastroenterol 2008; 14(10): 1479-1490
- URL: https://www.wjgnet.com/1007-9327/full/v14/i10/1479.htm
- DOI: https://dx.doi.org/10.3748/wjg.14.1479


