Copyright
©2008 The WJG Press and Baishideng.
World J Gastroenterol. Jan 7, 2008; 14(1): 46-52
Published online Jan 7, 2008. doi: 10.3748/wjg.14.46
Published online Jan 7, 2008. doi: 10.3748/wjg.14.46
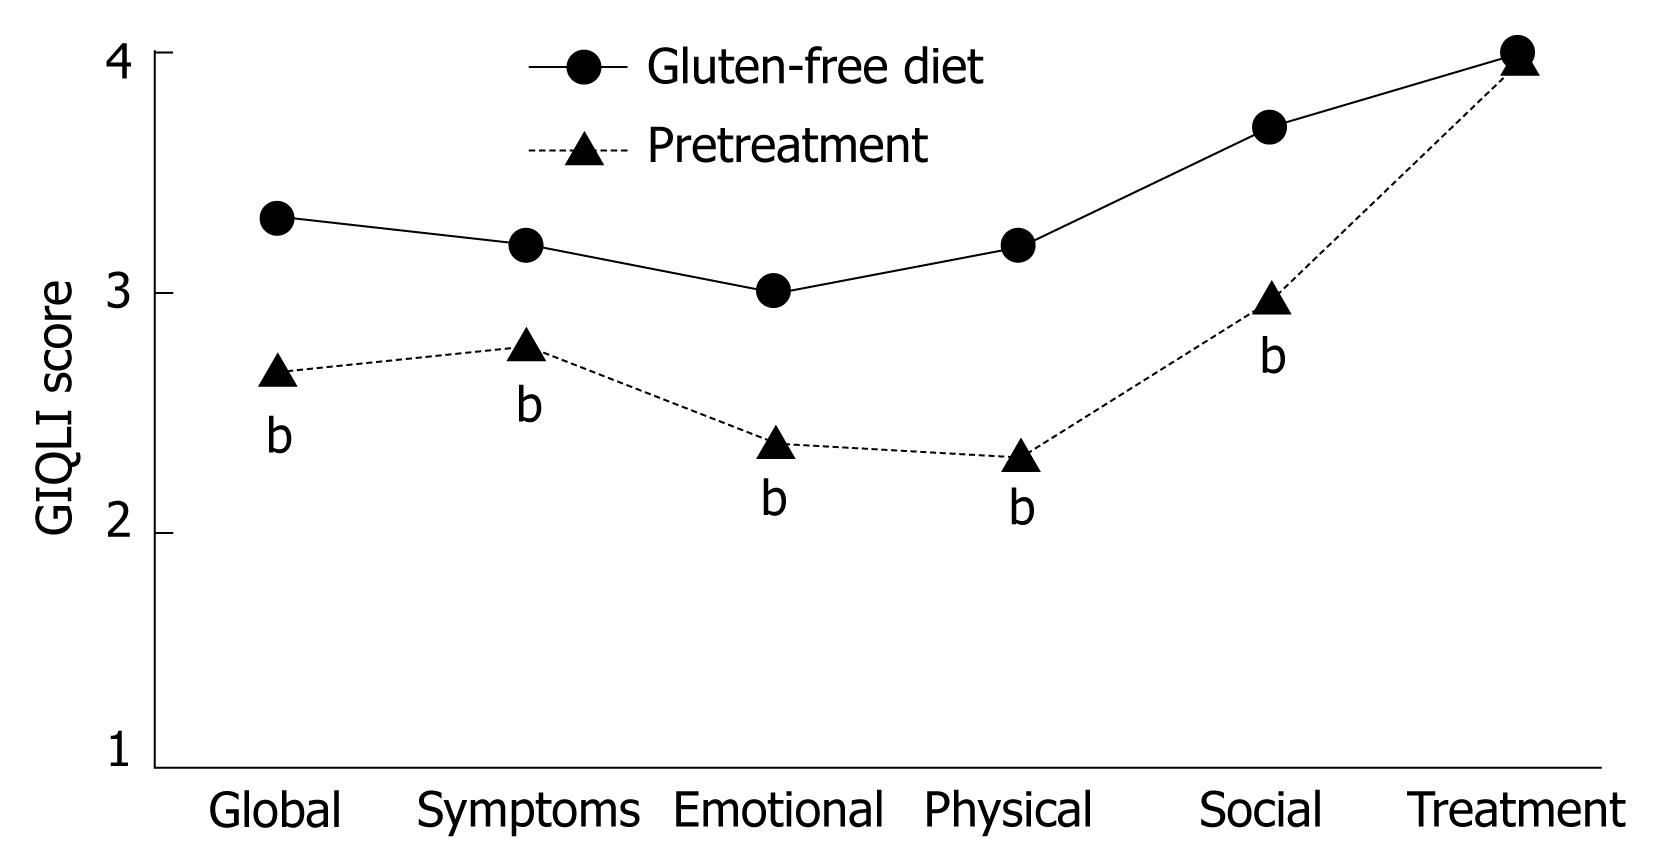
Figure 1 Median global and dimension scores of GIQLI for GFD (circles) and untreated (triangles) patients.
Scores were significantly higher (P < 0.001) for all dimensions except treatment. bP < 0.001.
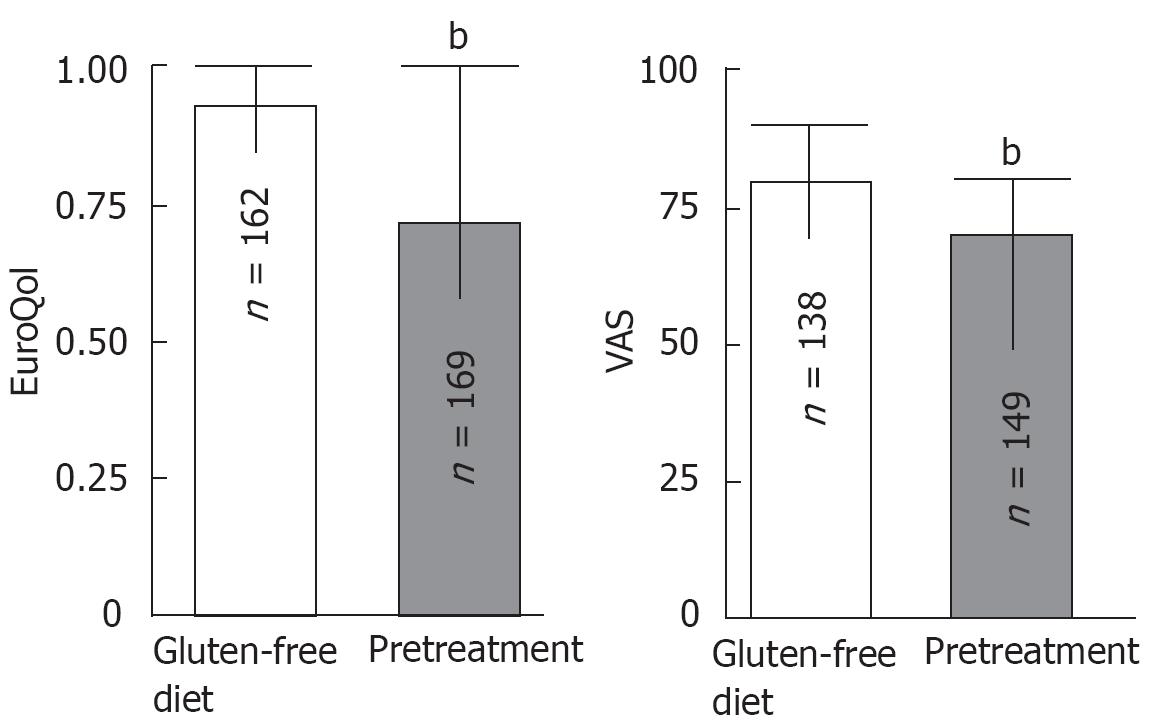
Figure 2 Median scores and 25th and 75th percentiles for the tariff and VAS of the EQ for GFD (white columns) and normal diet (grey columns).
Scores were significantly better (P < 0.001) for patients in the GFD group. bP < 0.001.
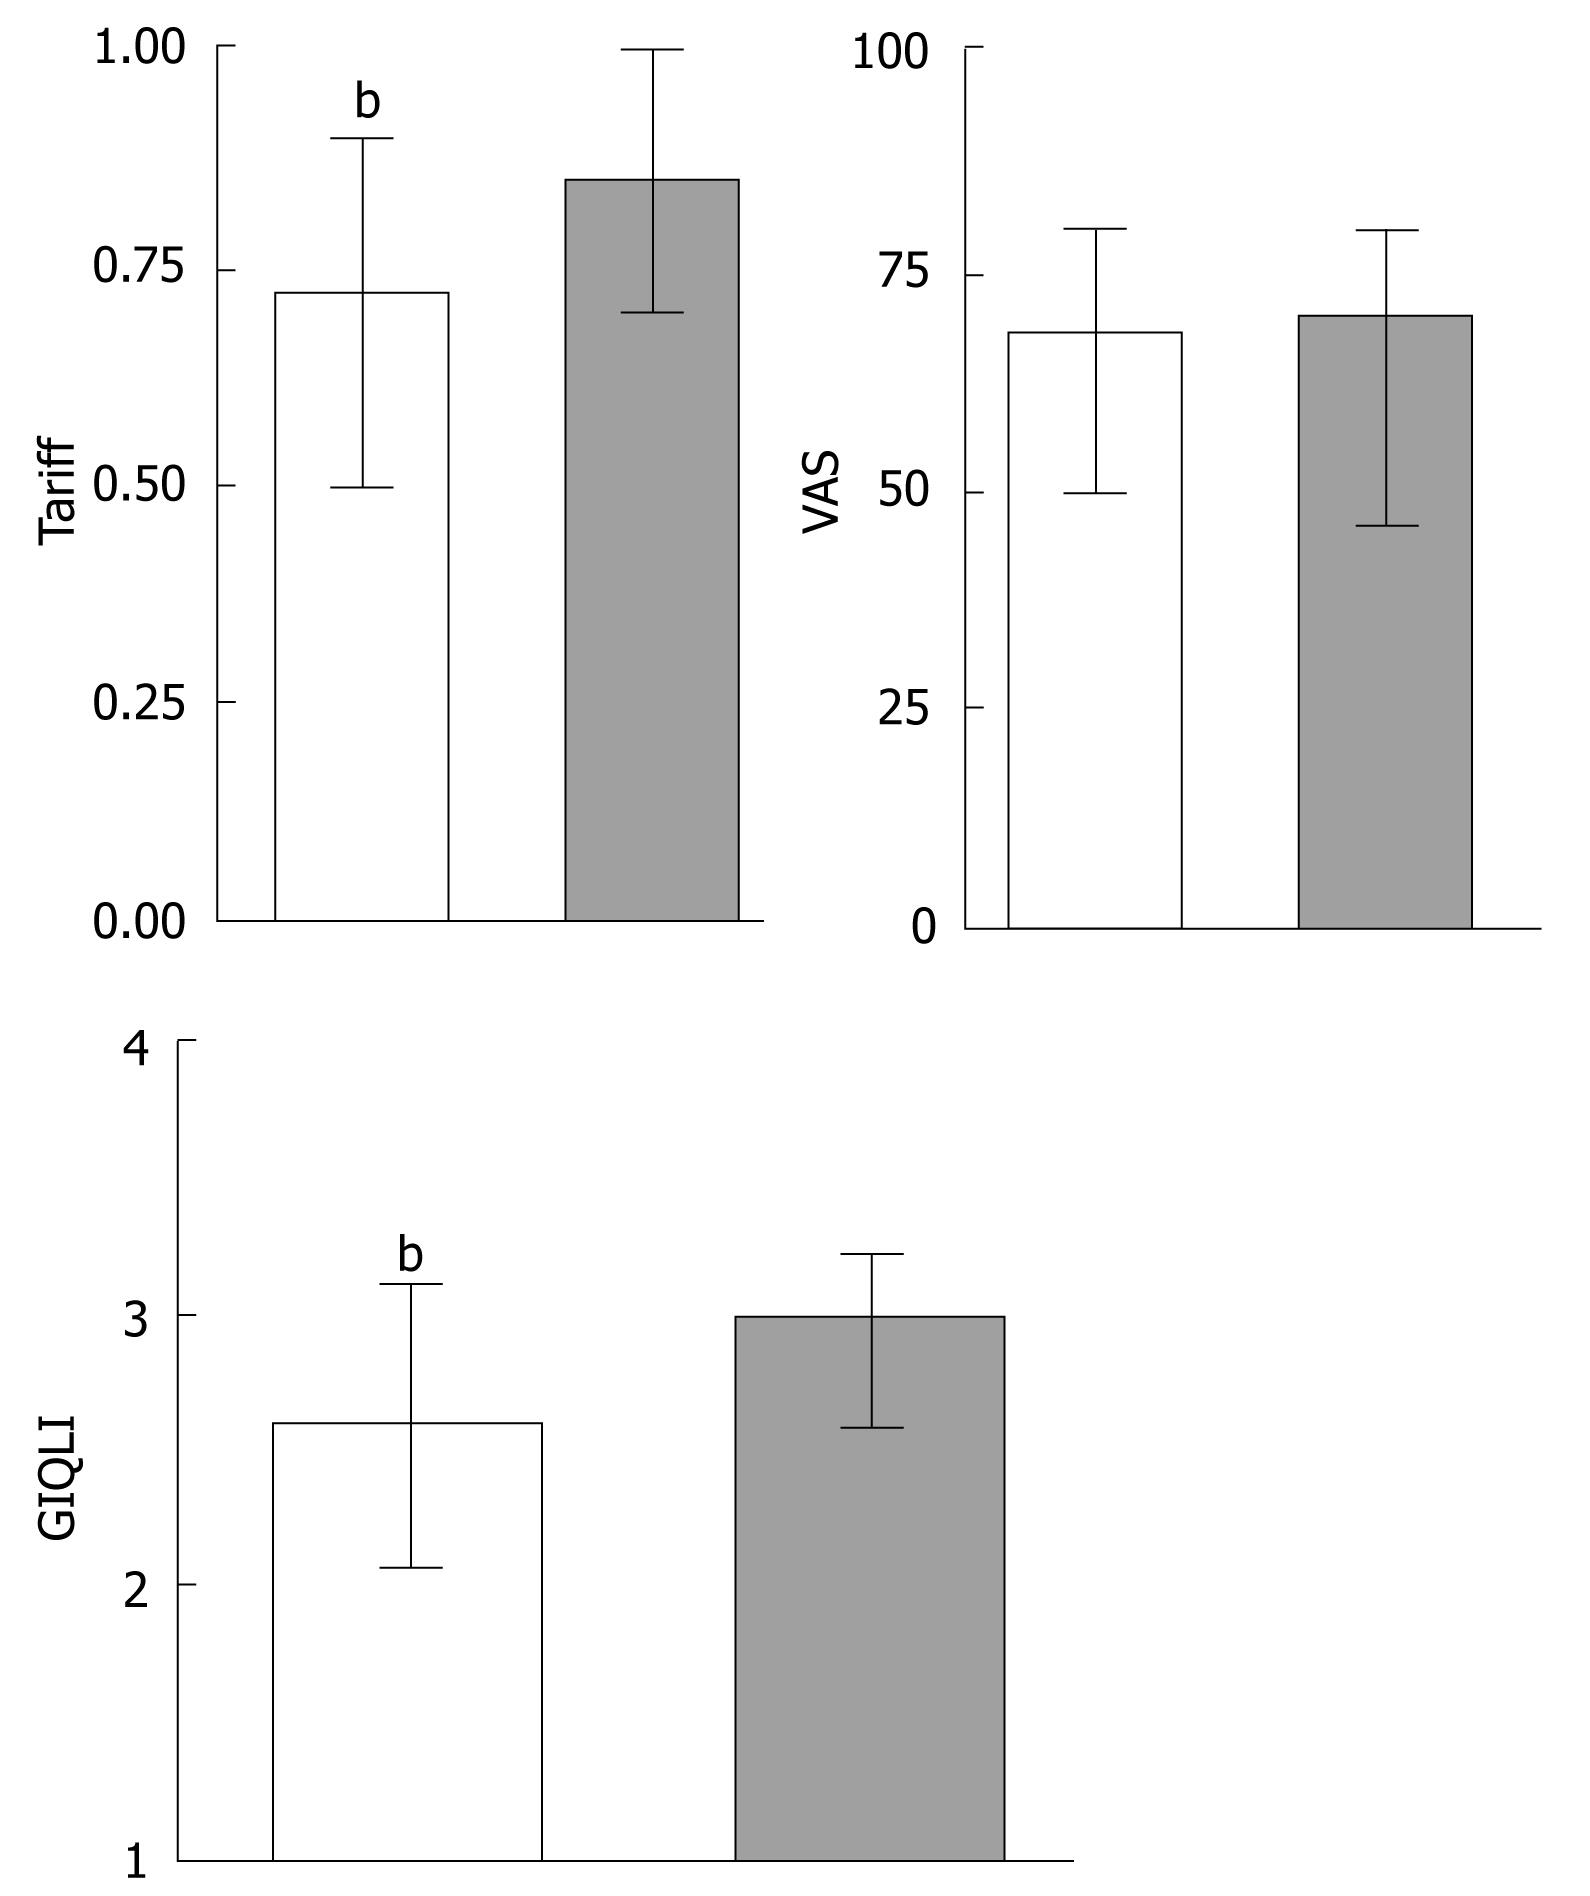
Figure 3 Median scores and 25th and 75th percentiles for the global GIQLI (left panel) and EQ index and VAS (right panel) in the pre-treated normal diet CD patients (white columns represents patients diagnosed due to symptoms and grey columns those diagnosed by serological tests).
Scores were significantly worse (P < 0.05) for patients diagnosed due to symptoms compared to those with isolated serologic tests. bP < 0.001.
- Citation: Casellas F, Rodrigo L, Vivancos JL, Riestra S, Pantiga C, Baudet J, Junquera F, Diví VP, Abadia C, Papo M, Gelabert J, Malagelada J. Factors that impact health-related quality of life in adults with celiac disease: A multicenter study. World J Gastroenterol 2008; 14(1): 46-52
- URL: https://www.wjgnet.com/1007-9327/full/v14/i1/46.htm
- DOI: https://dx.doi.org/10.3748/wjg.14.46


