Copyright
©2008 The WJG Press and Baishideng.
World J Gastroenterol. Jan 7, 2008; 14(1): 29-37
Published online Jan 7, 2008. doi: 10.3748/wjg.14.29
Published online Jan 7, 2008. doi: 10.3748/wjg.14.29
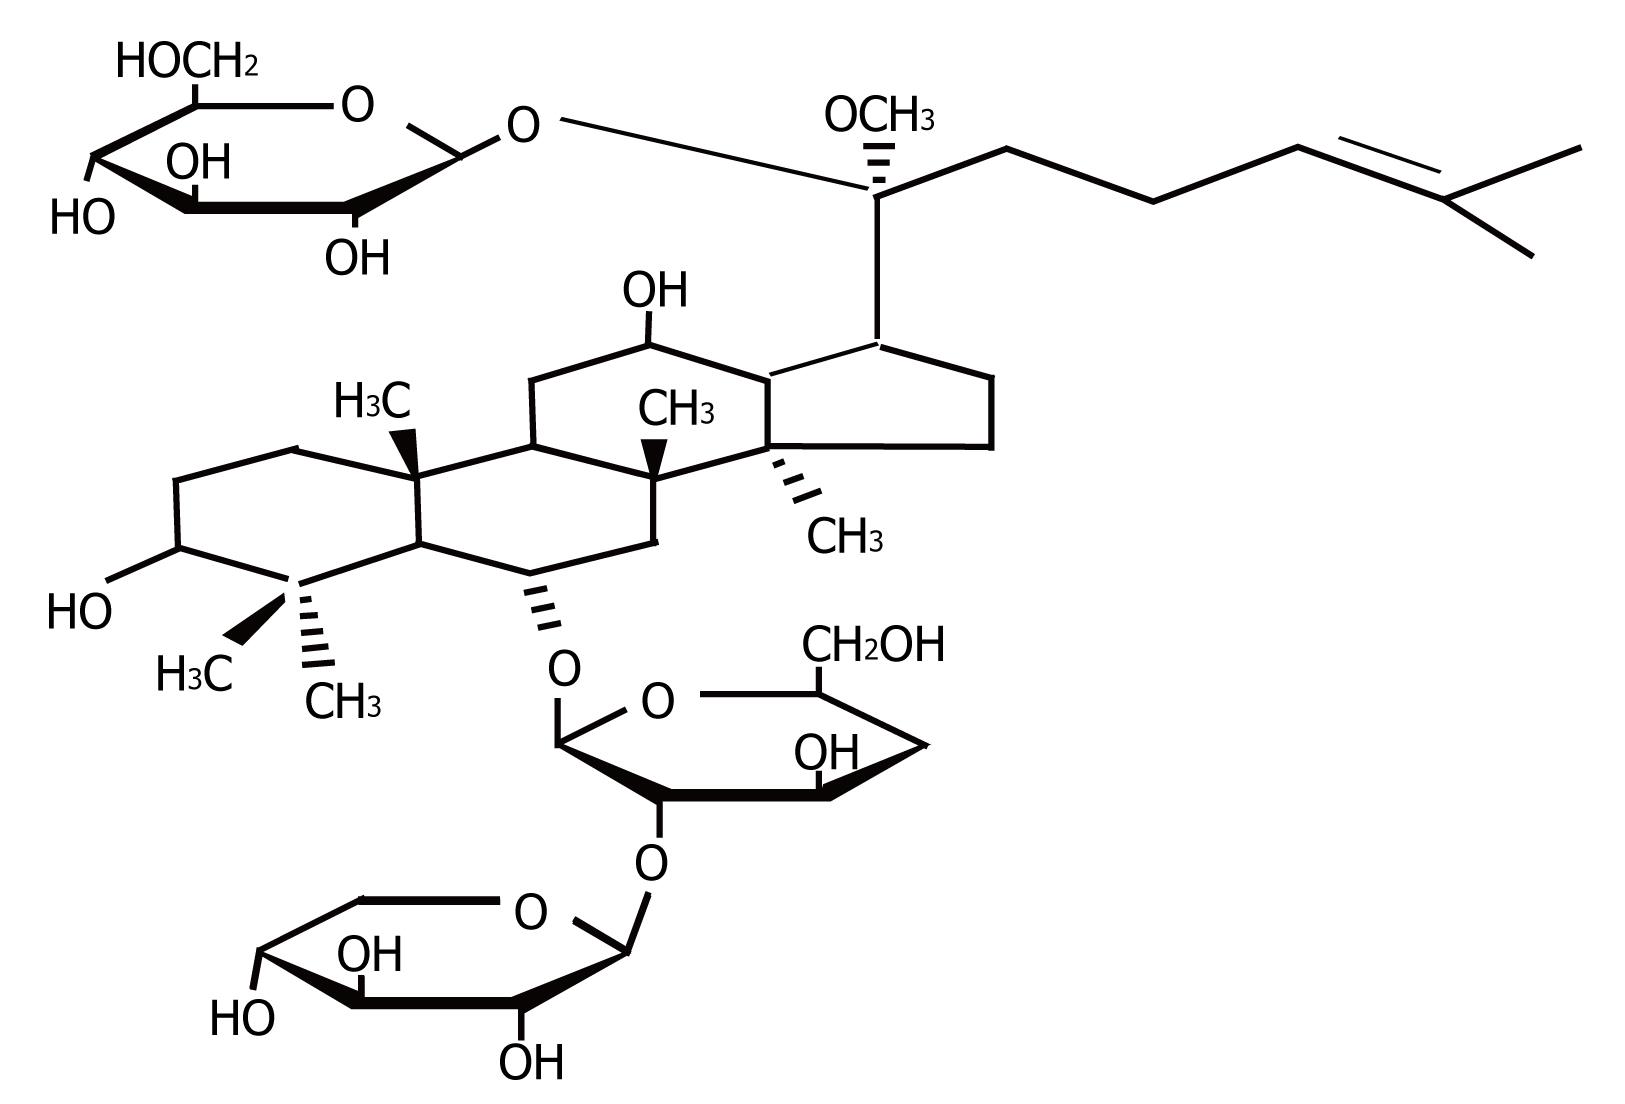
Figure 1 Chemical structure of notoginsenoside (R1).
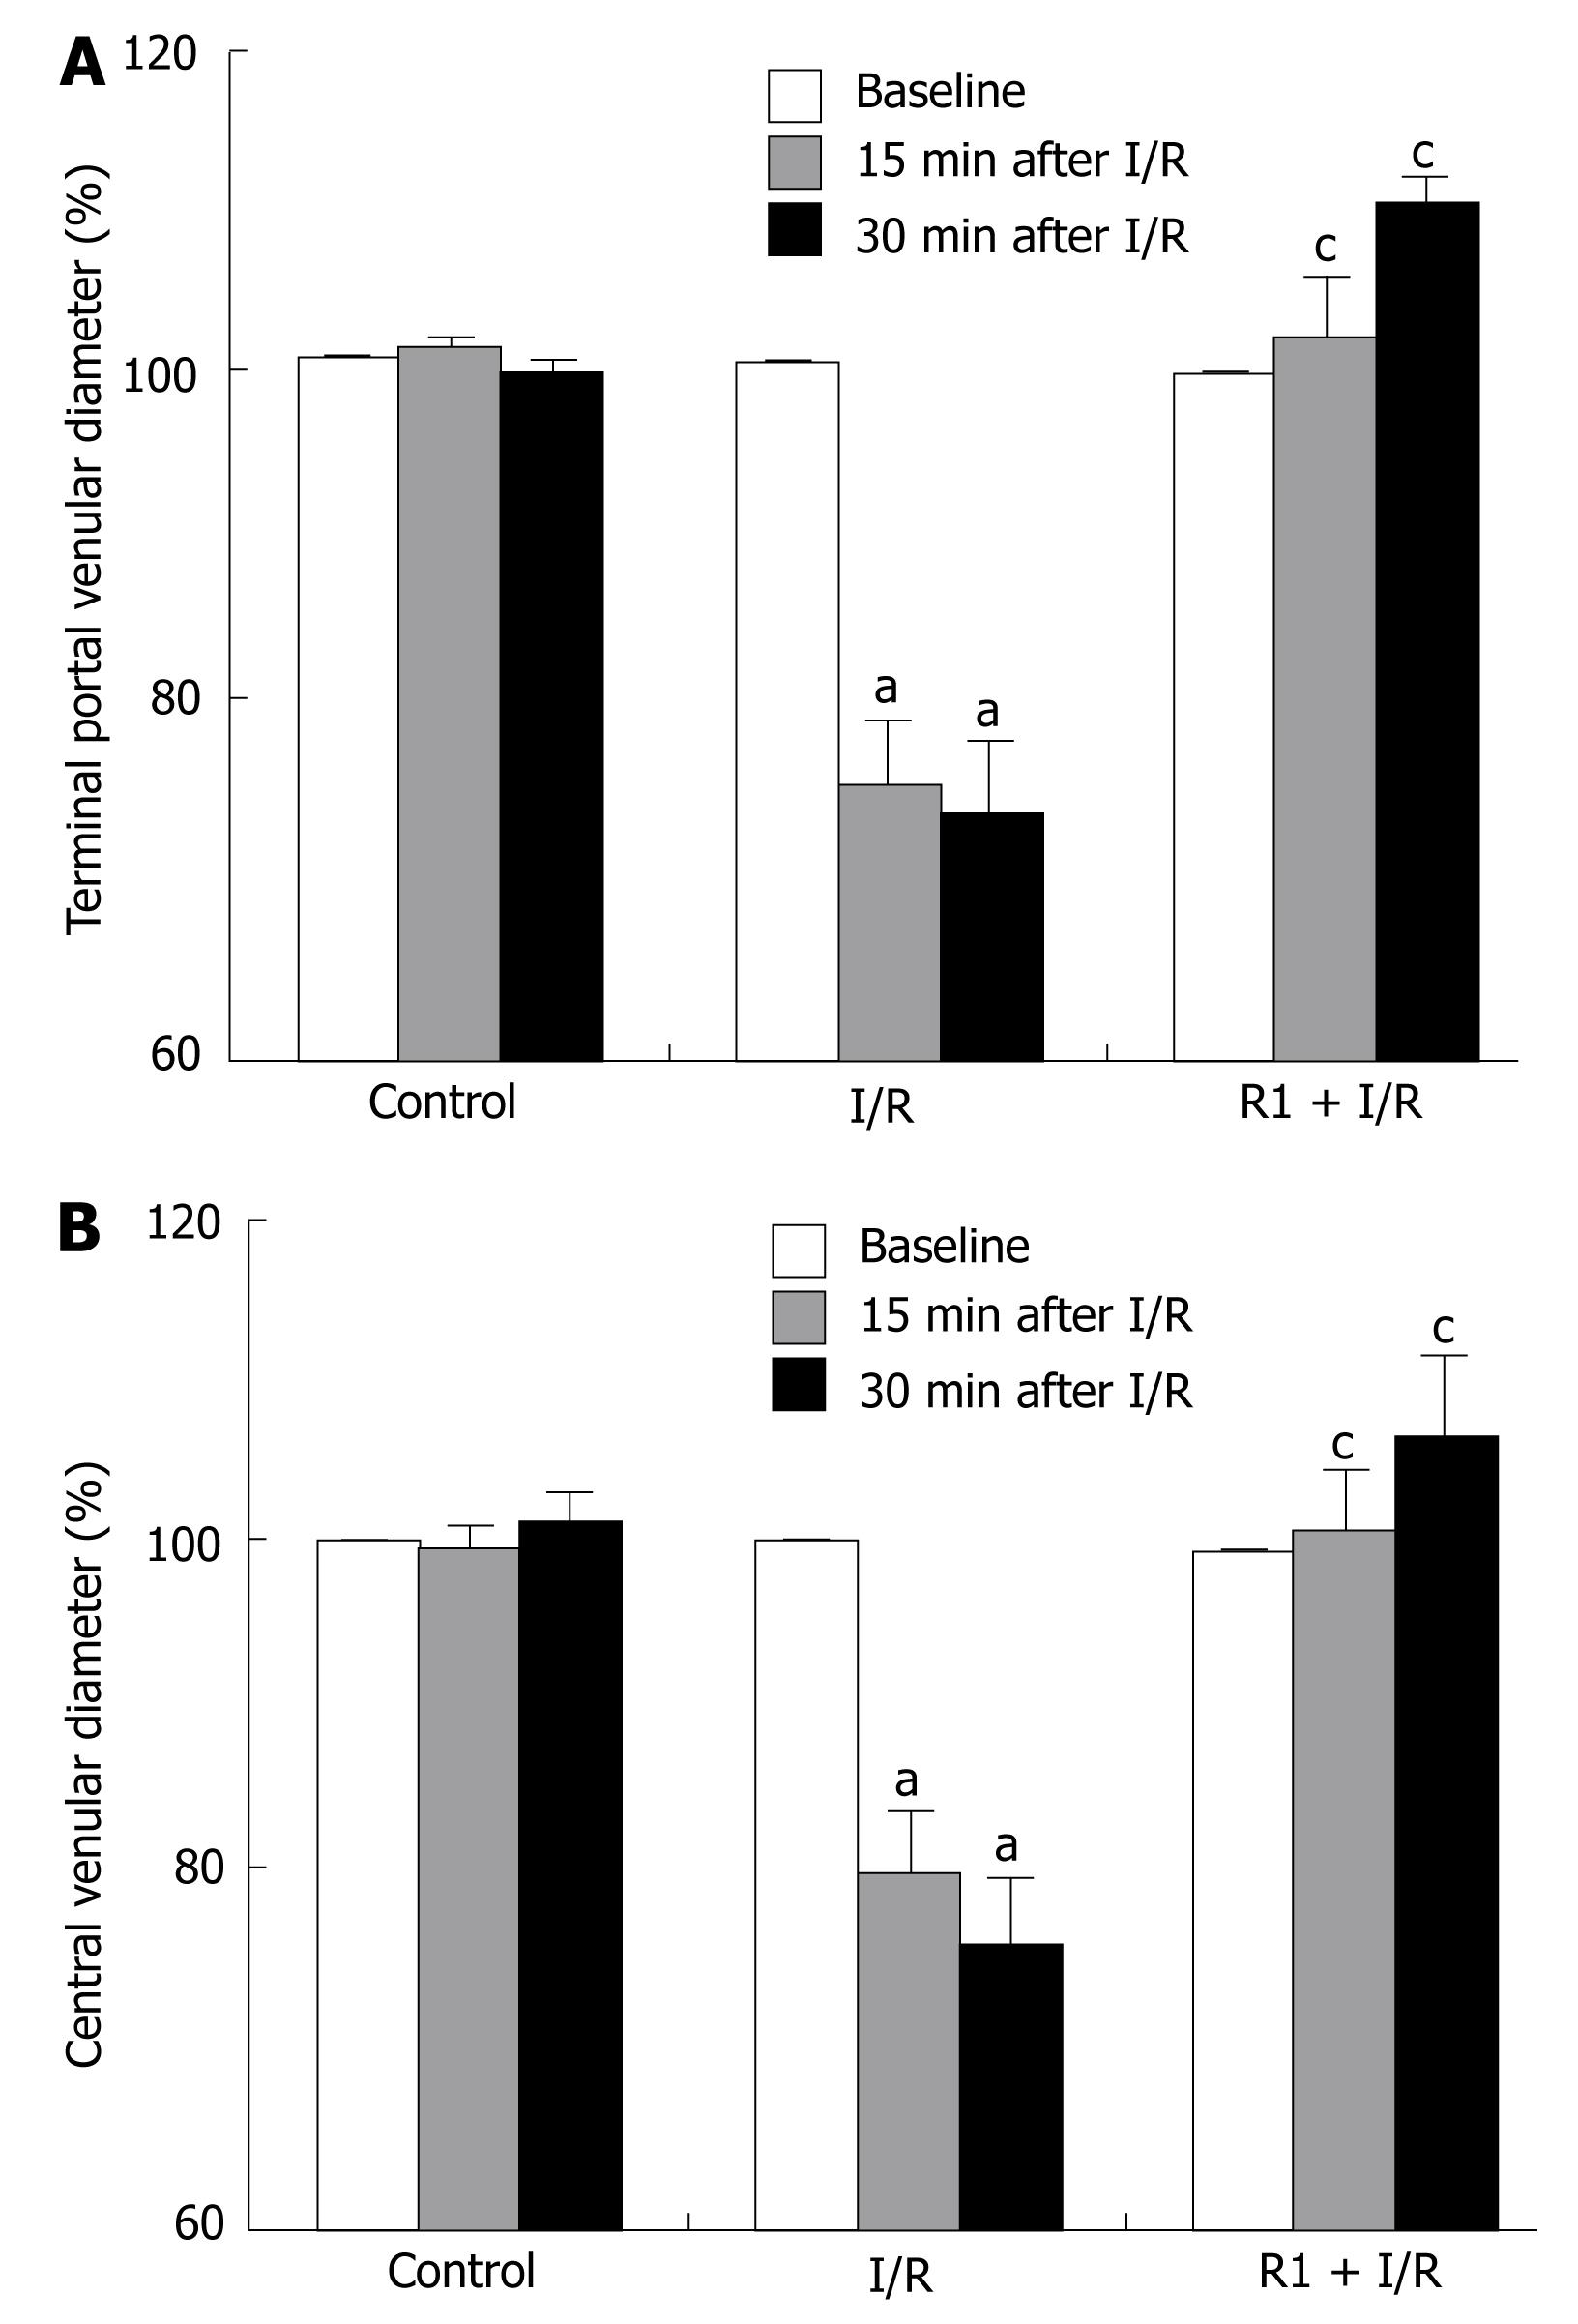
Figure 2 Effect of R1 on the terminal portal venular diameter (A) and central venular diameter (B) of hepatic venules of mice subjected to SMA I/R at 0 min before ischemia (Baseline) and 15 min, 30 min after reperfusion.
Abscissa represents the ratio of the diameter value at a time point to the baseline. The results are presented as mean ± SE from 6 animals. aP < 0.05 vs control, cP < 0.05 vs I/R.
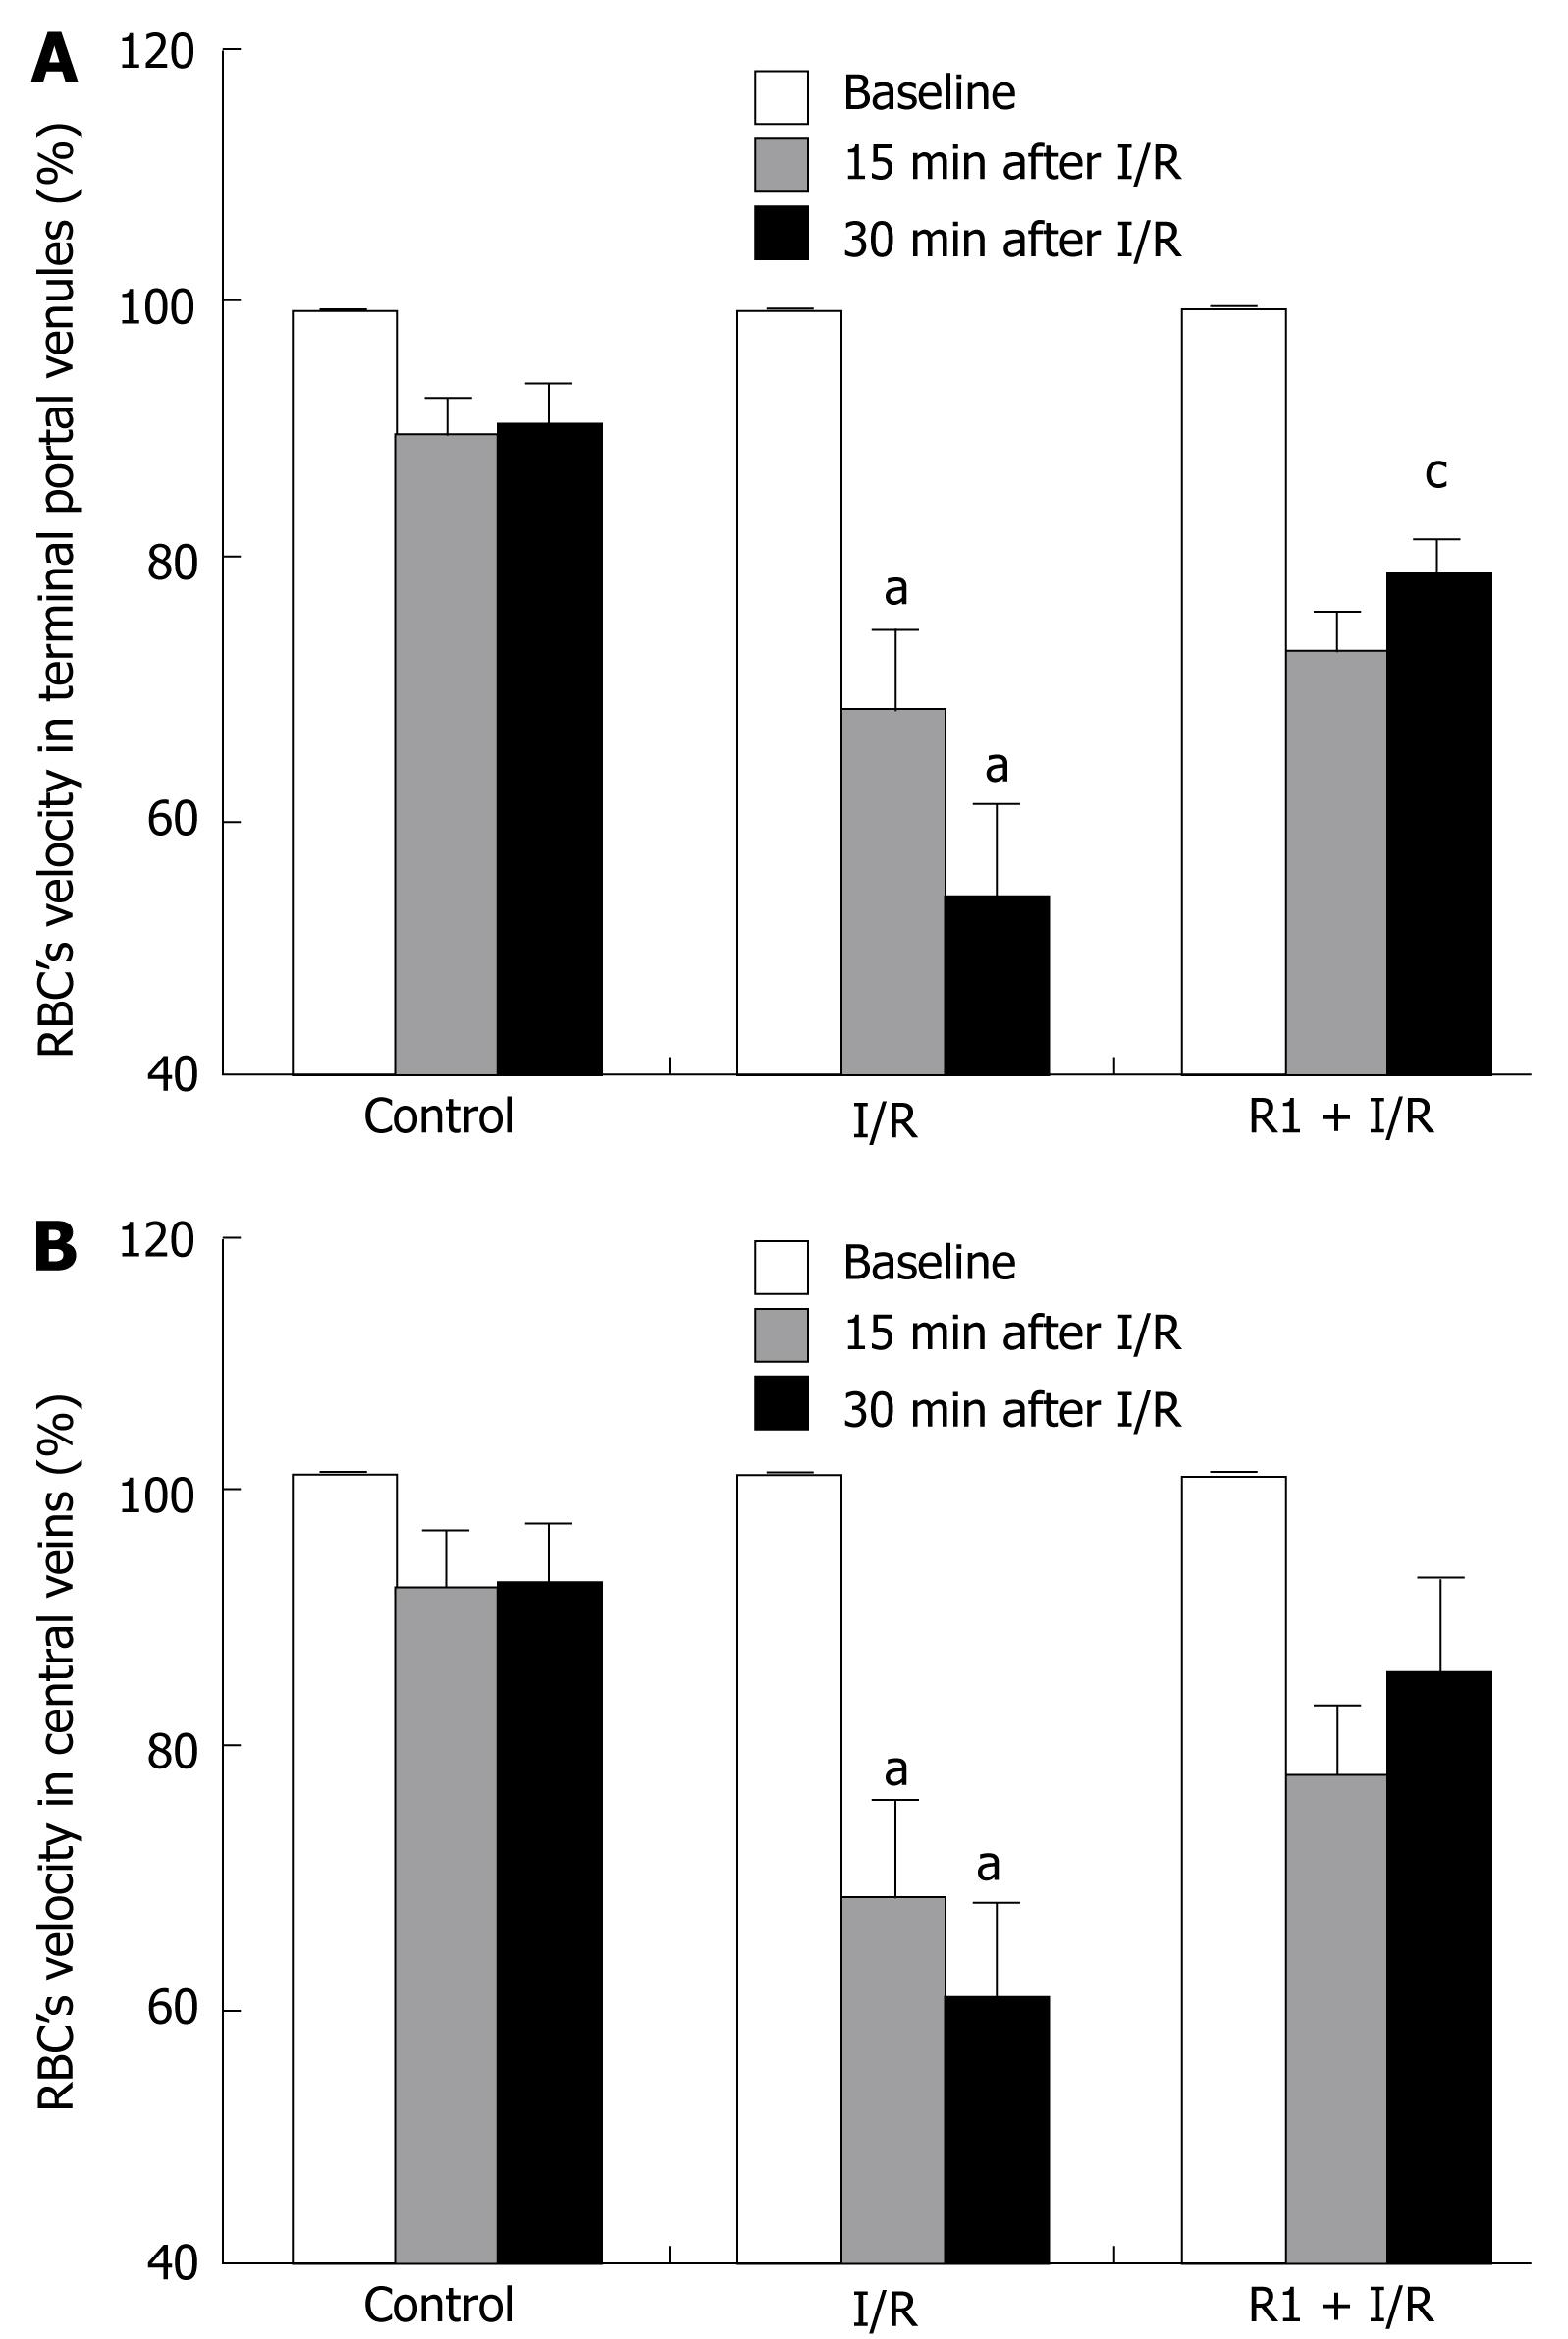
Figure 3 Effect of R1 on the RBC velocity in terminal portal venules (A) and in central veins (B) of mice subjected to SMA I/R at 0 min before ischemia (Baseline) and 15 min, 30 min after reperfusion.
Abscissa represents the ratio of the RBC velocity value at a time point to the baseline. The results are presented as mean ± SE from 6 animals. aP < 0.05 vs control, cP < 0.05 vs I/R.
Figure 4 Effect of R1 on the perfused hepatic sinusoids in the areas of terminal portal venules (A) and in the area of central veins (B) of mice subjected to SMA I/R at 0 min before ischemia (Baseline) and 15 min, 30 min after reperfusion.
Abscissa represents the ratio of perfused sinusoids at a time point to the baseline. The results are presented as mean ± SE from 6 animals. aP < 0.05 vs control, cP < 0.05 vs I/R.
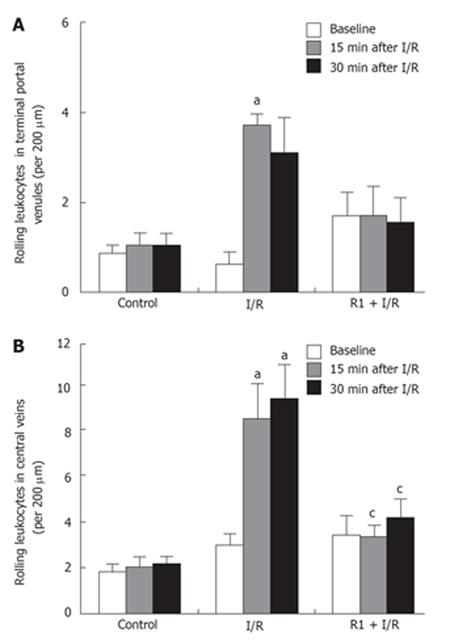
Figure 5 Effect of R1 on the rolling leukocytes in the areas of terminal portal venules (A) and central veins (B) of mice subjected to SMA I/R at 0 min before ischemia (Baseline) and 15 min, 30 min after reperfusion.
Abscissa represents the number of rolling leukocytes per 200 &mgr;m. The results are presented as mean ± SE from 6 animals. aP < 0.05 vs control, cP < 0.05 vs I/R.
Figure 6 Effect of R1 on the adherent leukocytes in terminal portal venules (A) and central veins (B) of mice subjected to SMA I/R at 0 min before ischemia (Baseline) and 15 min, 30 min after reperfusion.
Abscissa represents the number of adherent leukocytes per 200 &mgr;m. The results are presented as mean ± SE from 6 animals. aP < 0.05 vs control, cP < 0.05 vs I/R.
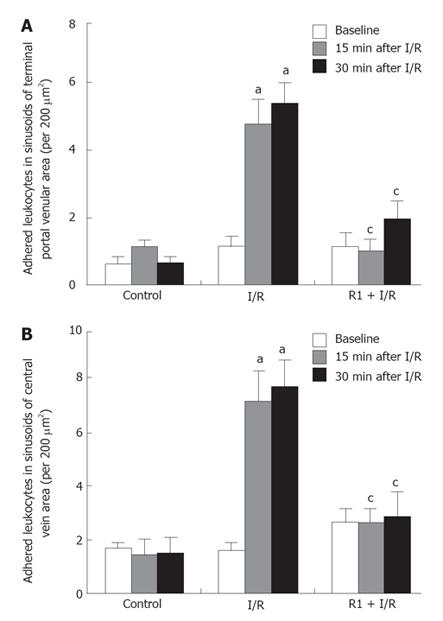
Figure 7 Effect of R1 on the adherent leukocytes in the hepatic sinusoids in the areas of terminal portal veins (A) and central veins (B) of mice subjected to SMA I/R at 0 min before ischemia (Baseline) and 15 min, 30 min after reperfusion.
Abscissa represents the number of adherent leukocytes per field of view of 200 &mgr;m2. The results are presented as mean ± SE from 6 animals. aP < 0.05 vs control, cP < 0.05 vs I/R.
Figure 8 Expression of E-selectin in mouse hepatic sinusoid in sham (A), I/R (B) and R1 + I/R (C) after 30 min of reperfusion.
HN: hepatocyte nucleus; EN: endothelium nucleus; HS: hepatic sinusoid; Bar indicates 20 &mgr;m.
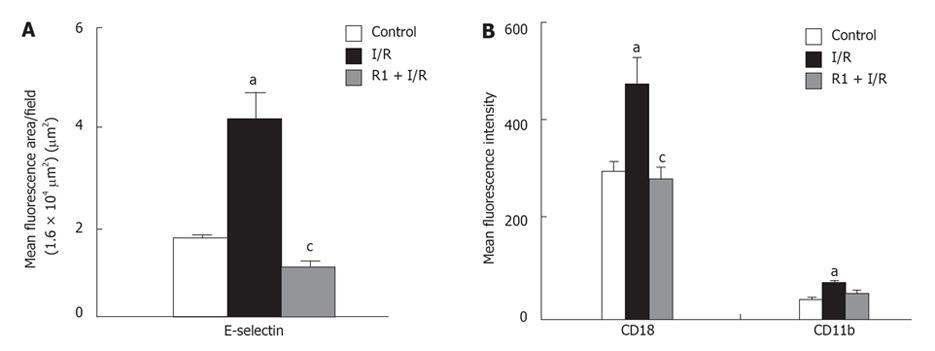
Figure 9 Effect of R1 on the expression of E-selectin in hepatic vessels (A) and CD18 and CD11b in neutrophils (B) of mice subjected to SMA I/R.
The results are presented as mean ± SE from 6 animals. aP < 0.05 vs control, cP < 0.05 vs I/R.
Figure 10 Effect of R1 on the concentration of LDH, ALT and AST in serum of mice subjected to SMA I/R.
The results are presented as mean ± SE from 6 animals. aP < 0.05 vs control, cP < 0.05 vs I/R.
- Citation: Chen WX, Wang F, Liu YY, Zeng QJ, Sun K, Xue X, Li X, Yang JY, An LH, Hu BH, Yang JH, Wang CS, Li ZX, Liu LY, Li Y, Zheng J, Liao FL, Han D, Fan JY, Han JY. Effect of notoginsenoside R1 on hepatic microcirculation disturbance induced by gut ischemia and reperfusion. World J Gastroenterol 2008; 14(1): 29-37
- URL: https://www.wjgnet.com/1007-9327/full/v14/i1/29.htm
- DOI: https://dx.doi.org/10.3748/wjg.14.29


