Copyright
©2007 Baishideng Publishing Group Co.
World J Gastroenterol. Mar 7, 2007; 13(9): 1352-1359
Published online Mar 7, 2007. doi: 10.3748/wjg.v13.i9.1352
Published online Mar 7, 2007. doi: 10.3748/wjg.v13.i9.1352
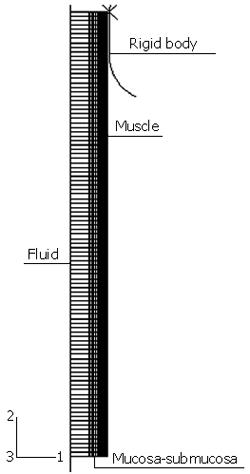
Figure 1 Geometrical model for the simulation of food transport process.
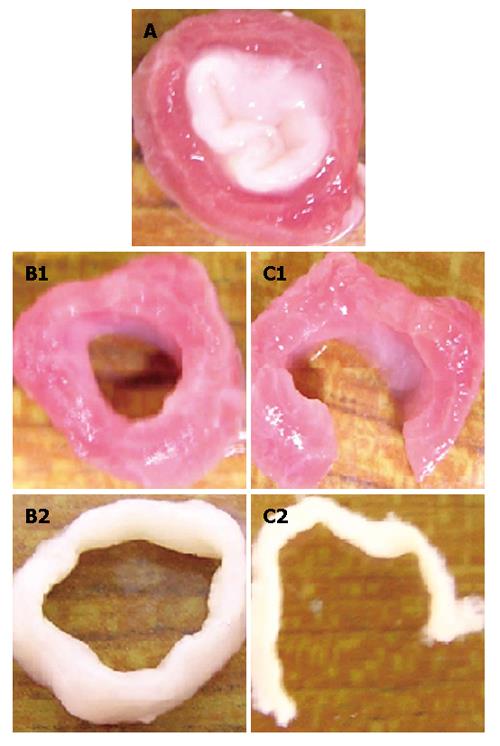
Figure 2 Procedure used to obtain the true zero-stress state and definition of three states: (A) Bonded no-load state; (B) separated no-load state; and (C) true zero-stress state.
Math 1 Math(A1).
Math 2 Math(A2).
Math 5 Math(A5).
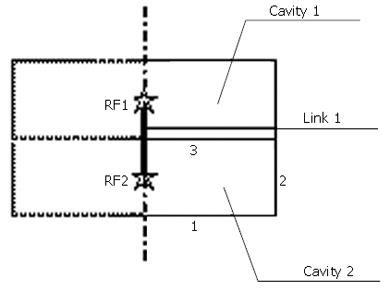
Figure 3 Example of the fluid element and fluid link element.
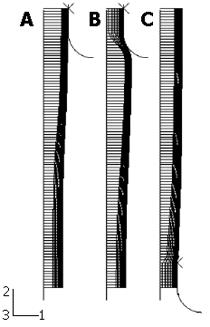
Figure 4 Bolus shape (A) before the muscle contraction (B) at the end of muscle contraction and (C) when the peristaltic wave reaches the LES.
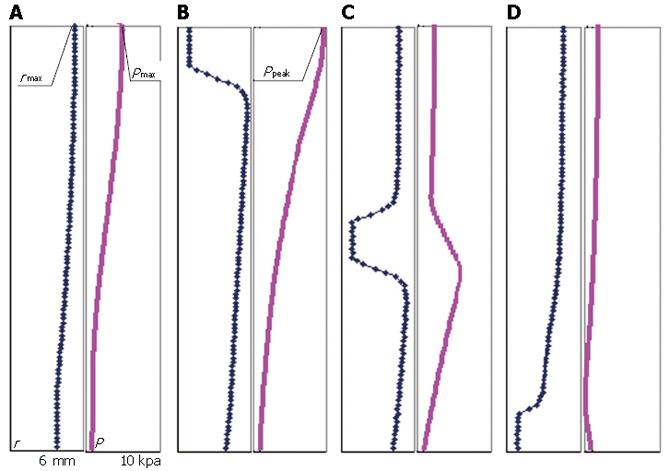
Figure 5 Bolus shape and intraluminal pressure distribution along the length (A) at the end of bolus filling and off response (before muscle contraction) (B) at the end of muscle contraction at the top 1 cm segment (C) when the peristaltic wave reaches the middle of the entire segment and (D) when the peristaltic wave reaches the end of segment (LES).
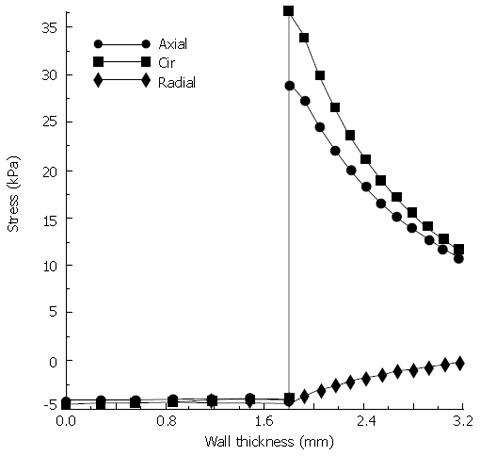
Figure 6 Stress distributions along the esophageal wall under the expansion of food bolus.
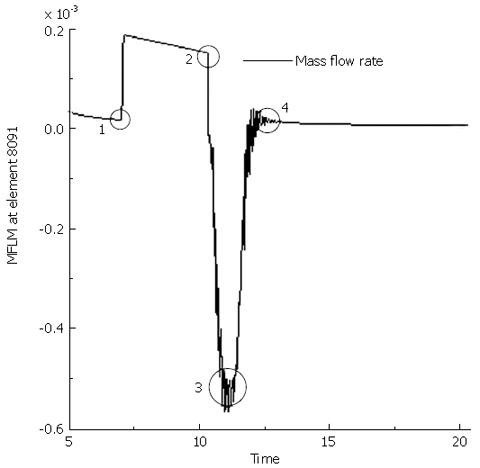
Figure 7 Mass flow rate at fluid link element 8091 (1 cm away from the top end connecting the fluid cavity 5091 and 5090) during the muscle contraction and wave transport.
1 represents the moment when the rigid body is in contact with the tissue structure (start of contraction); 2 the end of contraction at the top 1 cm segment; 3 when the contraction wave leaves the fluid cavity 5091 (1 s after contraction); 4 when the contraction wave is 1 cm away from cavity 5091 (2 s after contraction).
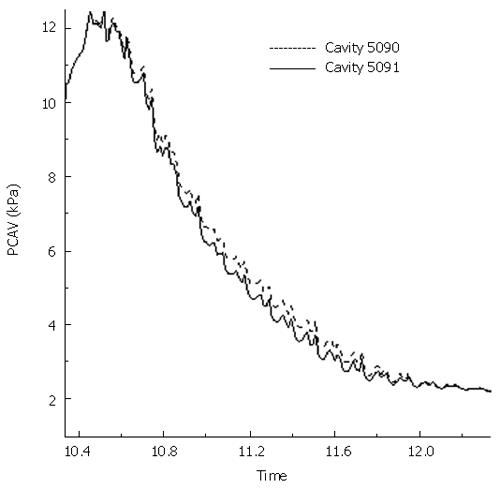
Figure 8 Intraluminal pressure at cavity 5090 and 5091 during the two seconds of fluid reflux.
- Citation: Yang W, Fung TC, Chian KS, Chong CK. Finite element simulation of food transport through the esophageal body. World J Gastroenterol 2007; 13(9): 1352-1359
- URL: https://www.wjgnet.com/1007-9327/full/v13/i9/1352.htm
- DOI: https://dx.doi.org/10.3748/wjg.v13.i9.1352


