Copyright
©2007 Baishideng Publishing Group Co.
World J Gastroenterol. Feb 28, 2007; 13(8): 1187-1194
Published online Feb 28, 2007. doi: 10.3748/wjg.v13.i8.1187
Published online Feb 28, 2007. doi: 10.3748/wjg.v13.i8.1187
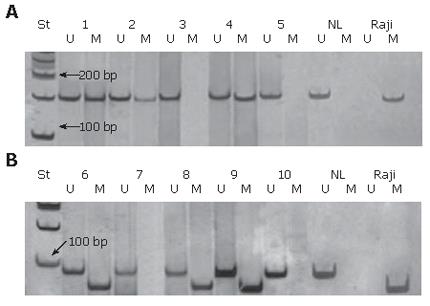
Figure 1 Analysis of p16 (A) and MGMT (B) gene methylation by MSP.
The presence of a visible PCR product in lanes U indicates the presence of unmethylated genes of p16 (151 bp) and MGMT (93 bp); the presence of product in lanes M indicates the presence of methylated genes of p16 (150 bp) and MGMT (81 bp). The samples of colorectal carcinoma 1, 2 and 4 show p16 promoter hypermethylation, while 6, 8 and 9 show MGMT promoter hypermethylation. NL-normal lymphocytes as a positive control for unmethylated alleles; Raji-commercial cell line as a positive control for methylated alleles; St-molecular weight marker (50 bp).
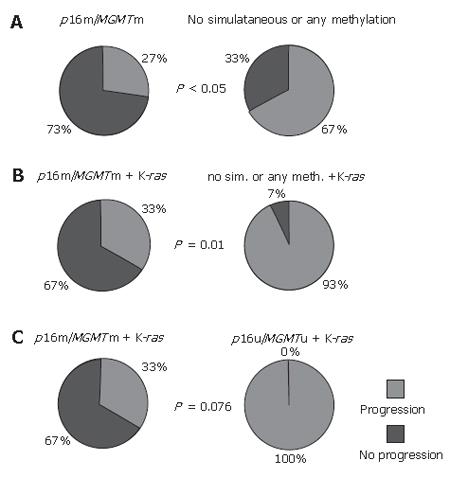
Figure 2 Graphical distribution of progression of the disease in the two-year period, as a function of simultaneous p16 and MGMT methylation status (A); simultaneous p16, MGMT methylation and mutated K-ras gene compared either to no simultaneous or any methylation of two genes (B) or to unmethylated both (C), respectively.
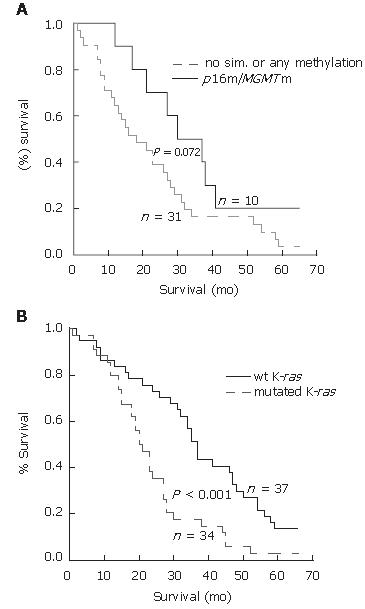
Figure 3 Overall survival among the patients with CRC according to the methylation status of p16 and MGMT genes (A), and mutational status of K-ras gene (B).
Overall survival is longer in the group of the patients with simultaneous methylation of p16 and MGMT gene than in group with no simultaneous or any methylation (P = 0.072, Log-rank test). Overall survival is significantly lower in the group of patients with mutated K-ras than in group with unchanged, wild type K-ras gene (P < 0.001, Log-rank test). Survival curves were constructed by Kaplan-Meier method.
-
Citation: Krtolica K, Krajnovic M, Usaj-Knezevic S, Babic D, Jovanovic D, Dimitrijevic B. Comethylation of
p 16 andMGMT genes in colorectal carcinoma: Correlation with clinicopathological features and prognostic value. World J Gastroenterol 2007; 13(8): 1187-1194 - URL: https://www.wjgnet.com/1007-9327/full/v13/i8/1187.htm
- DOI: https://dx.doi.org/10.3748/wjg.v13.i8.1187


