Copyright
©2007 Baishideng Publishing Group Co.
World J Gastroenterol. Feb 21, 2007; 13(7): 997-1002
Published online Feb 21, 2007. doi: 10.3748/wjg.v13.i7.997
Published online Feb 21, 2007. doi: 10.3748/wjg.v13.i7.997
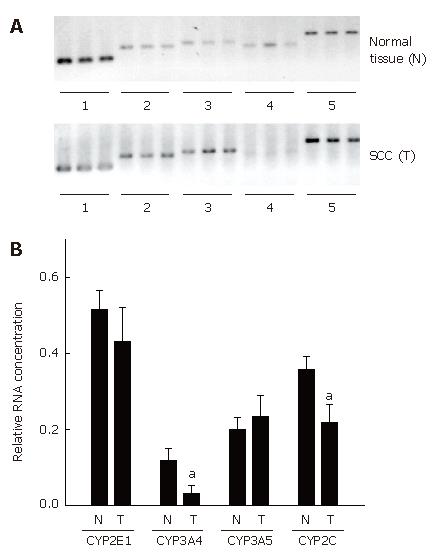
Figure 1 CYP3A5, CYP2E1, CYP3A4, and CYP2C mRNA expression in esophagus of untreated SCC patients.
A: Representative photomicrograph of RT-PCR products of untreated esophageal SCC patients (N = normal esophageal tissue, T = tumor tissue obtained from SCC patients). Measurements were carried out either in triplicate or in case of reduced mRNA availability in duplicate. Lanes 1, 6: histone 3.3, lanes 2, 7: CYP2C, lanes 3, 8: CYP2E1, lanes 4, 9: CYP3A4, lanes 5, 10: CYP3A5; B: Densitometric analysis of CYP2C, CYP2E1, CYP3A4, and CYP3A5 mRNA expression in normal esophageal tissue and SCC. Results are normalized to histone 3.3 expression. Data are means ± SE. aP < 0.05 vs normal tissue.
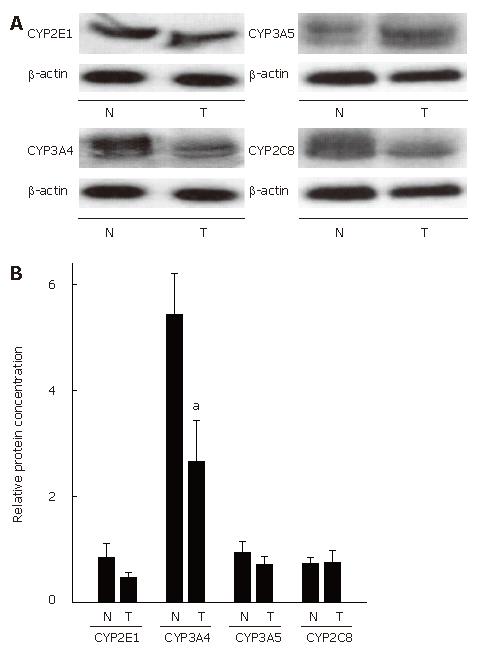
Figure 2 Protein levels of CYP2C8, CYP2E1, CYP3A4, and CYP3A5 in macroscopically normal tissue and SCC patients A: Representative Western blots of CYP2C8, CYP2E1, CYP3A4, and CYP3A5 in macroscopically normal esophageal tissue (N) and SCC (T) esophageal SCC patients; B: Quantitative analysis of blots.
Results are normalized to β-actin. Data are means ± SE. aP < 0.05 vs normal tissue.
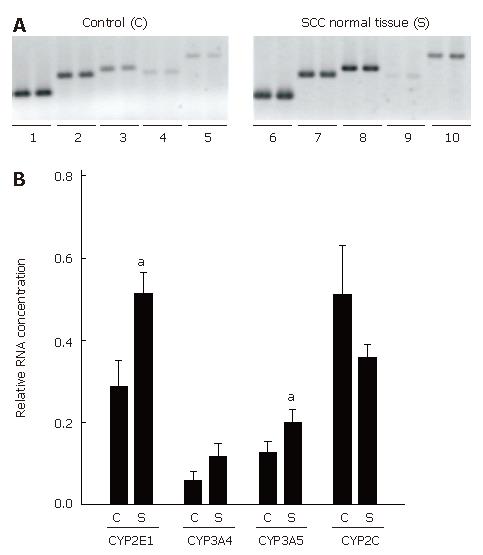
Figure 3 Expression of CYP2C8, CYP2E1, CYP3A4, and CYP3A5 in macroscopically normal tissue of SCC patients and controls.
A: Representative photomicrograph of RT-PCR products determined in normal tissue of patients with untreated esophageal SCC (S) and controls (C). All measurements were carried out in dupilcate. Lanes 1, 6: histone 3.3, lanes 2, 7: CYP2C, lanes 3, 8: CYP2E1, lanes 4, 9: CYP3A4, lanes 5, 10: CYP3A5; B: Quantitative analysis of CYP2C, CYP2E1, CYP3A4, and CYP3A5 mRNA expression in normal esophageal tissue of SCC patients and controls. Results are normalized to histone 3.3 expression. Data are means ± SE. aP < 0.05 vs normal tissue.
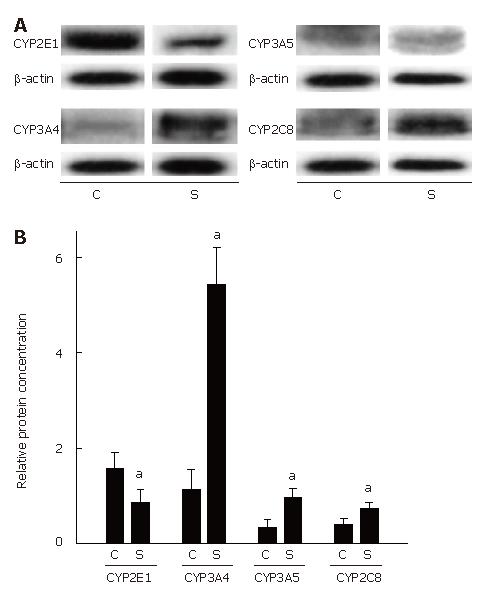
Figure 4 CYP3A5, CYP2E1, CYP3A4, and CYP2C protein levels in esophagus of SCC patients and disease-free controls.
A: Representative Western blot of CYPs determined in normal tissue of untreated esophageal SCC patients (S) and disease-free controls (C); B: Quantitative analysis of CYP2C, CYP2E1, CYP3A4, and CYP3A5 protein levels in normal esophageal tissue of SCC patients and disease-free controls. Results are normalized to β-actin. Data are means ± SE. aP < 0.05 vs disease-free controls.
- Citation: Bergheim I, Wolfgarten E, Bollschweiler E, Hölscher A, Bode C, Parlesak A. Cytochrome P450 levels are altered in patients with esophageal squamous-cell carcinoma. World J Gastroenterol 2007; 13(7): 997-1002
- URL: https://www.wjgnet.com/1007-9327/full/v13/i7/997.htm
- DOI: https://dx.doi.org/10.3748/wjg.v13.i7.997


