Copyright
©2007 Baishideng Publishing Group Co.
World J Gastroenterol. Feb 21, 2007; 13(7): 1018-1026
Published online Feb 21, 2007. doi: 10.3748/wjg.v13.i7.1018
Published online Feb 21, 2007. doi: 10.3748/wjg.v13.i7.1018
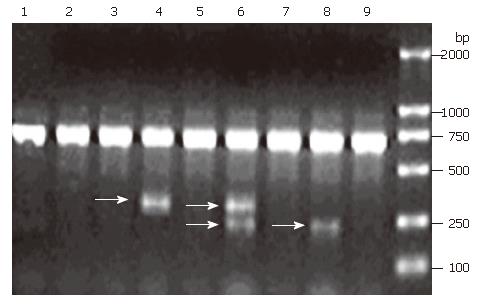
Figure 1 Frequency of intragenic deletions in FHIT transcripts in human CRC.
Gel photo of FHIT RT-PCR products showing that the full length FHIT was the predominant transcript in samples 1-3, 5, 7 and 9. Both full length FHIT and shorter fragments representing transcripts containing deletions in FHIT could be seen in samples 4, 6 and 7. The arrow shows the gel position of splice variants.
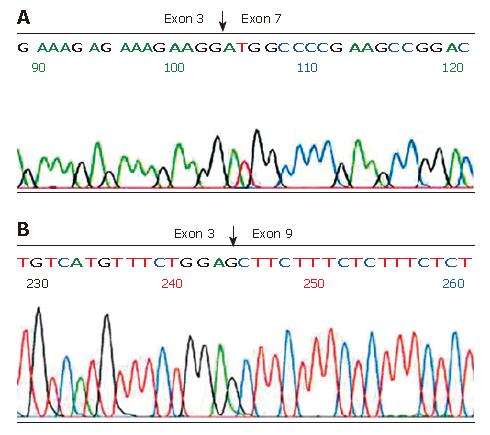
Figure 2 Sequencing analysis of aberrant FHIT transcripts.
A: Deletion of exons 4-6 in the FHIT gene; B: Deletion of exons 4-8 in the FHIT gene.
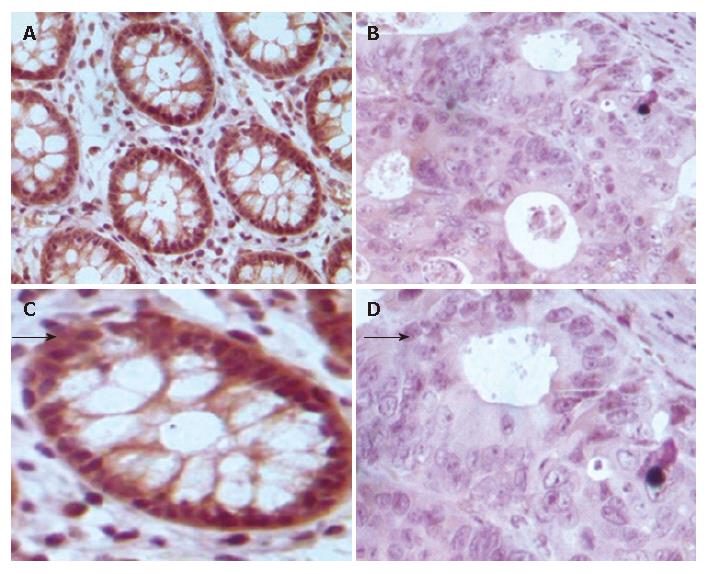
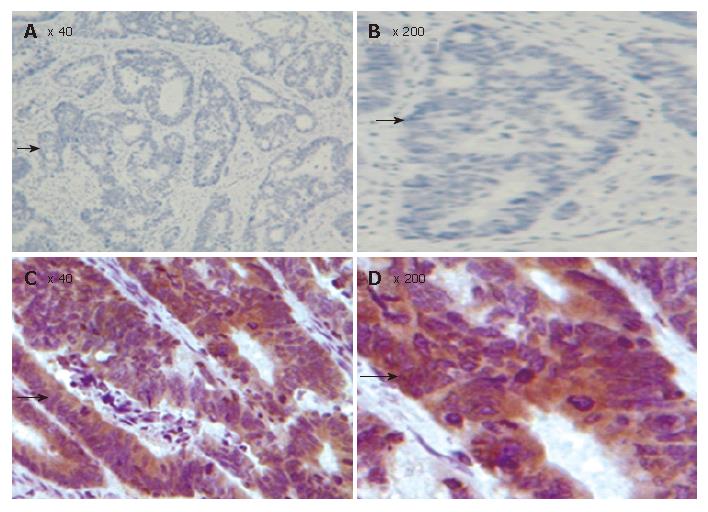
Figure 3 TMA-IHC assay showing significantly decreased FHIT expression in normal colonic mucosal samples (A), CRC tissue samples (B), and magnified views of the respective samples A and B (C and D).
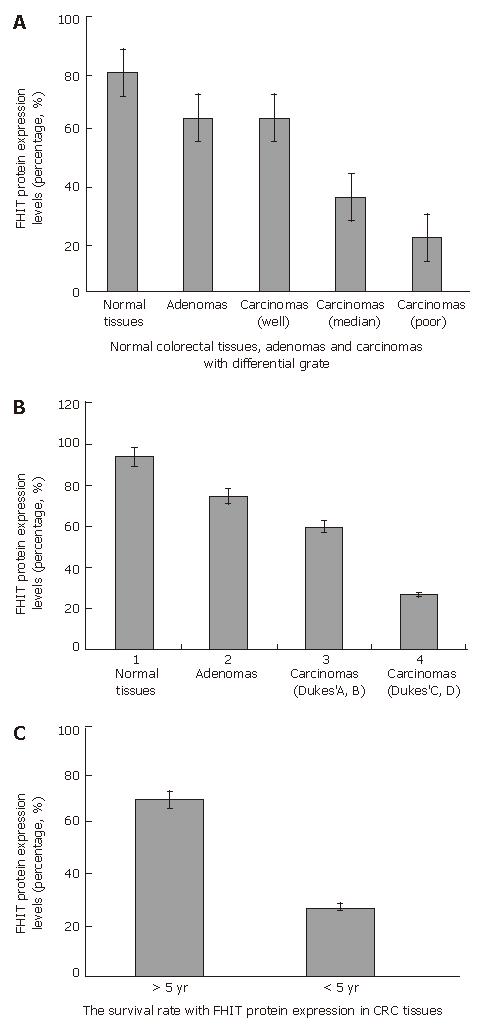
Figure 4 Relationships between FHIT expression and CRC differentiation grade (A) and stage (B), and survival rate (C) CRC patients.
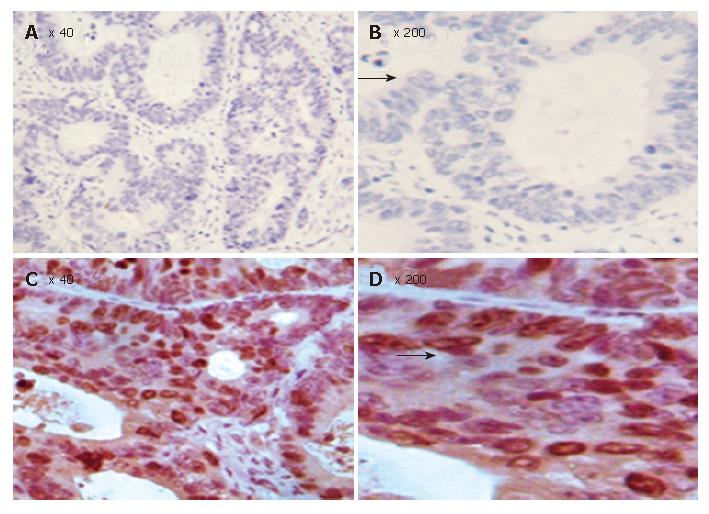
Figure 5 TUNEL assay showing significantly decreased apoptosis in FHIT-negative CRC cells (A), FHIT-positive CRC cells (C), and magnified views of the respective samples A and C (B and D).
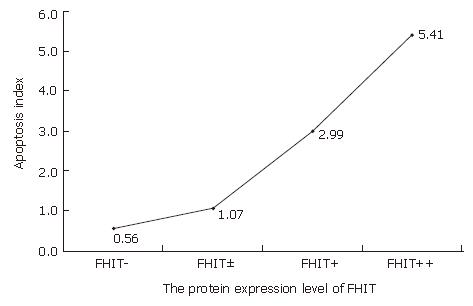
Figure 6 Decreased FHIT expression and apoptosis inhibition in human CRC.
Reduced apoptosis index was detected in the same number of cells per field in CRC with FHIT-negative expression.
Figure 7 TMA-IHC showing significantly decreased Bax expression in FHIT positive CRC tissue samples (A), FHIT-negative CRC tissue samples (C), and magnified views of the respective samples A and C (B and D).
Figure 8 TMA-IHC showing significantly increased Bcl-2 expression FHIT positive CRC tissue samples (A), FHIT-negative CRC tissue samples (C), and magnified views of the respective samples A and C (B and D).
Figure 9 TMA-IHC showing significantly increased survivin expression in FHIT- positive CRC tissue samples (A), FHIT-negative CRC tissue samples (C), and magnified views of the respective samples A and C (B and D).
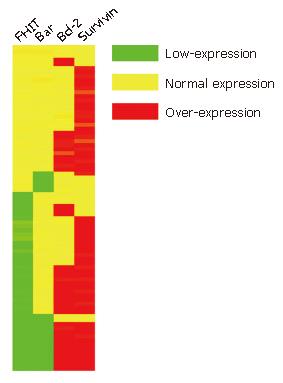
Figure 10 Tree-view of differential protein expression data from 80 CRC tissue samples.
Tree-view demonstrated the FHIT protein expression related to Bax, Bcl-2 and survivin protein expression. Red indicates up-regulation, green indicates down-regulation, and yellow indicates no significant change.
- Citation: Cao J, Chen XP, Li WL, Xia J, Du H, Tang WB, Wang H, Chen XW, Xiao HQ, Li YY. Decreased fragile histidine triad expression in colorectal cancer and its association with apoptosis inhibition. World J Gastroenterol 2007; 13(7): 1018-1026
- URL: https://www.wjgnet.com/1007-9327/full/v13/i7/1018.htm
- DOI: https://dx.doi.org/10.3748/wjg.v13.i7.1018


