Copyright
©2007 Baishideng Publishing Group Co.
World J Gastroenterol. Feb 7, 2007; 13(5): 791-795
Published online Feb 7, 2007. doi: 10.3748/wjg.v13.i5.791
Published online Feb 7, 2007. doi: 10.3748/wjg.v13.i5.791
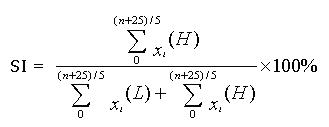
Math 1 Math(A1).
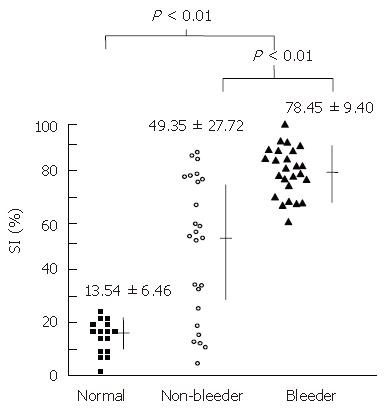
Figure 1 Comparison of portal shunt index in normal subjects and cirrhotic patients, with and without variceal bleeding.
Data shown as mean (horizontal bar) ± SD (vertical bar).
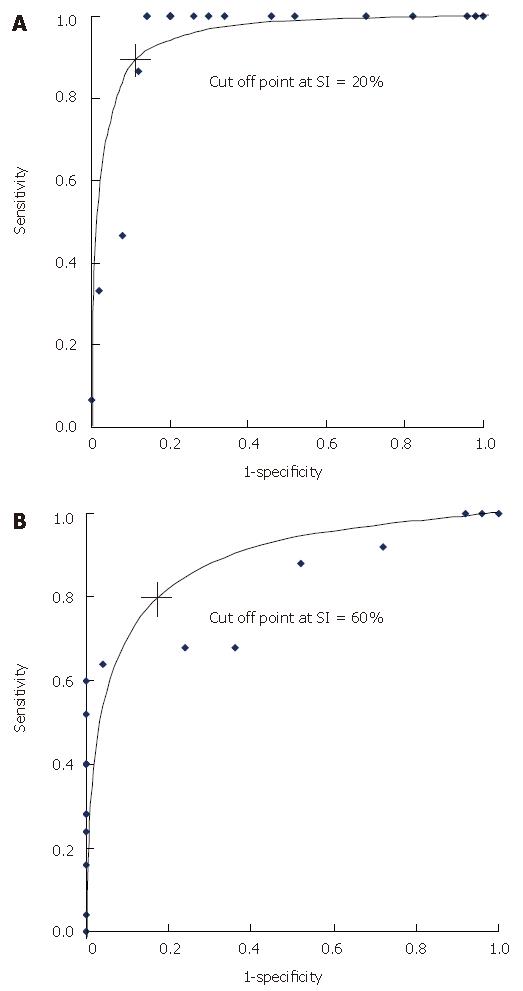
Figure 2 ROC curves of the portal shunt indices.
A: Between normal subjects and cirrhotic patients with esophageal varices; B: Between cirrhotic patients with and without variceal bleeding (bleeder vs non-bleeder). + Indicates a cutoff point with maximum discrimination.
- Citation: Chitapanarux T, Praisontarangkul OA, Thongsawat S, Pisespongsa P, Leerapun A. Per rectal portal scintigraphy as a useful tool for predicting esophageal variceal bleeding in cirrhotic patients. World J Gastroenterol 2007; 13(5): 791-795
- URL: https://www.wjgnet.com/1007-9327/full/v13/i5/791.htm
- DOI: https://dx.doi.org/10.3748/wjg.v13.i5.791


