Copyright
©2007 Baishideng Publishing Group Co.
World J Gastroenterol. Feb 7, 2007; 13(5): 732-739
Published online Feb 7, 2007. doi: 10.3748/wjg.v13.i5.732
Published online Feb 7, 2007. doi: 10.3748/wjg.v13.i5.732
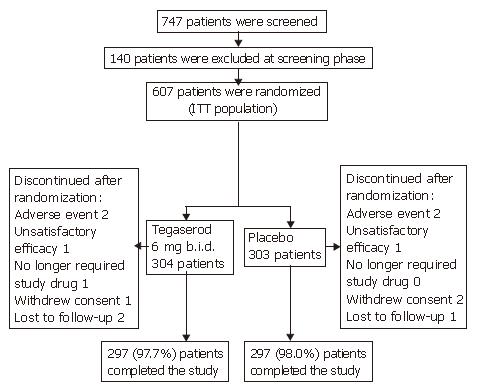
Figure 1 Participant flow.
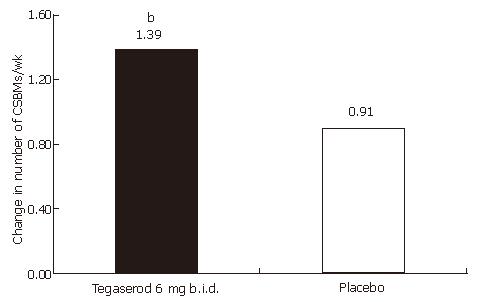
Figure 2 Change from baseline in the number of CSBMs per week (wk 1-4) by treatment (ITT population).
Footnote: bP = 0.0002 vs placebo; Mean number of CSBMs per week at baseline: tegaserod 0.36; placebo 0.31.
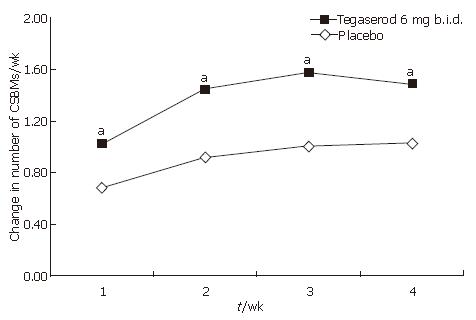
Figure 3 Change from baseline in the number of CSBMs per week by study week and treatment (ITT population).
Footnote: aP < 0.05 vs placebo; Mean number of CSBMs per week at baseline: tegaserod 0.36; placebo 0.31.
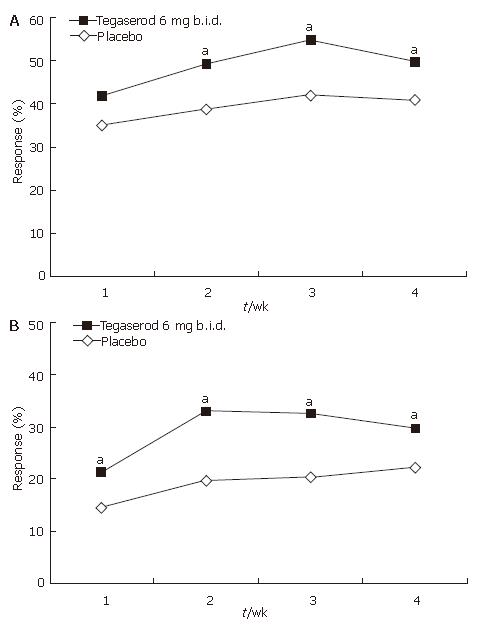
Figure 4 A: Response rate relative to baseline (increase of ≥ 1 CSBM per week) by week (ITT population); B: Absolute response rate (increase of ≥ 3 CSBM per week) (ITT population).
aP < 0.05 vs placebo; Mean number of CSBMs per week at baseline: tegaserod 0.36; placebo 0.31.
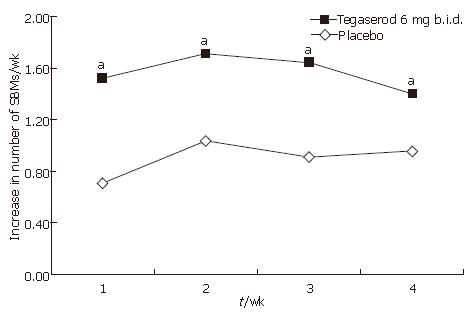
Figure 5 Change from baseline in number of SBMs per week by study week and treatment (ITT population).
aP < 0.05 vs placebo; Mean number of SBMs per week at baseline: tegaserod 2.33; placebo 2.26.
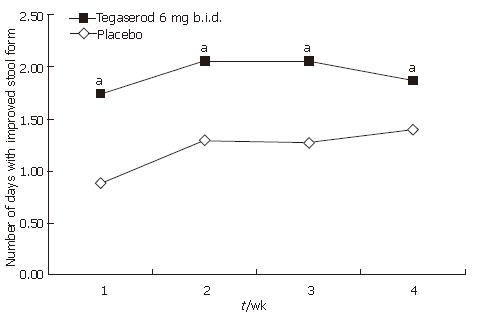
Figure 6 Change from baseline in number of days per week with no stool, hard, or very hard stools by treatment (ITT population).
aP < 0.05 vs placebo; An improvement was defined as a decrease in the number of days with no stool, hard, or very hard stools (Bristol stool score of 1 or 2[19]) relative to baseline.
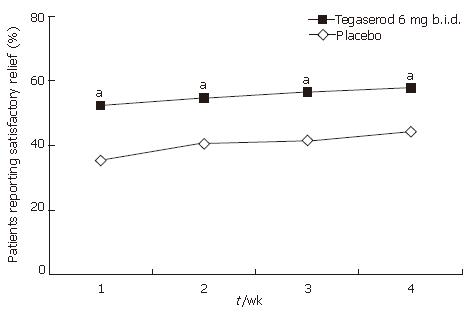
Figure 7 Satisfactory relief of constipation symptoms by week and treatment period (ITT population).
aP < 0.05 vs placebo.
- Citation: Lin SR, Ke MY, Luo JY, Yuan YZ, Wang JY, diTommaso S, Walter V, Huang J. A randomized, double-blind, placebo-controlled trial assessing the efficacy and safety of tegaserod in patients from China with chronic constipation. World J Gastroenterol 2007; 13(5): 732-739
- URL: https://www.wjgnet.com/1007-9327/full/v13/i5/732.htm
- DOI: https://dx.doi.org/10.3748/wjg.v13.i5.732


