Copyright
©2007 Baishideng Publishing Group Co.
World J Gastroenterol. Feb 7, 2007; 13(5): 692-698
Published online Feb 7, 2007. doi: 10.3748/wjg.v13.i5.692
Published online Feb 7, 2007. doi: 10.3748/wjg.v13.i5.692
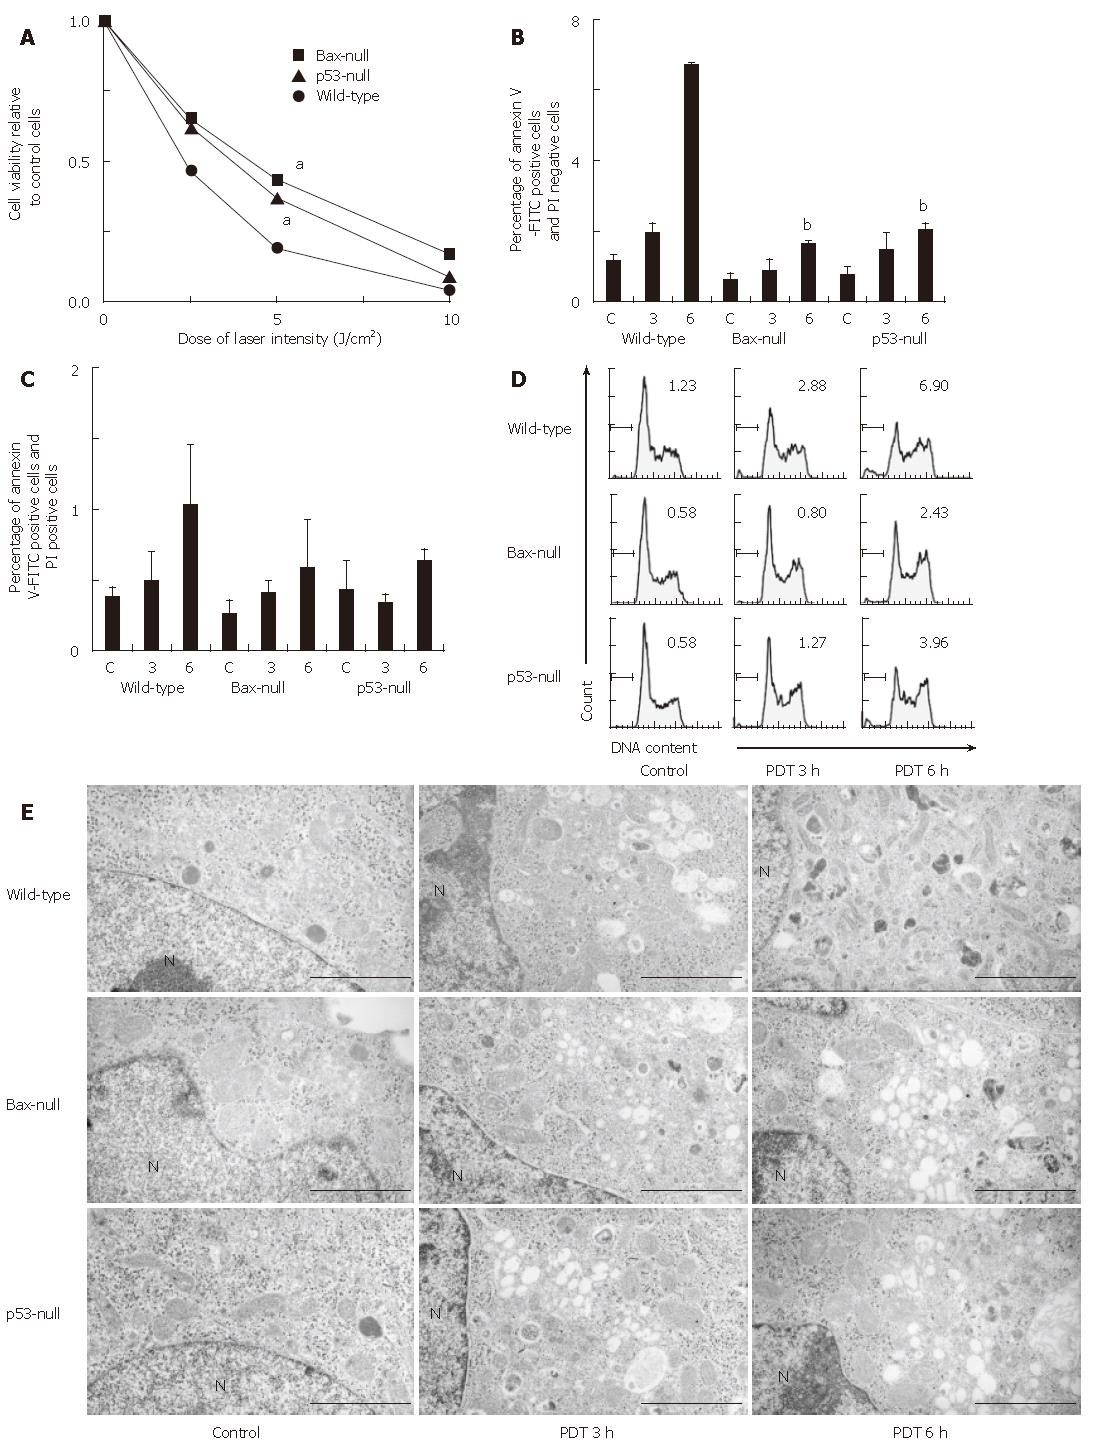
Figure 1 ATX-S10Na(II)-PDT-mediated cell death and early apoptosis were Bax- and p53-dependent.
Cells were treated with, or without, ATX-S10Na(II)-PDT and harvested at each indicated time point following irradiation. A: Phototoxicity was determined by MTT assay 24 h after laser irradiation. Data are expressed as a ratio of cell viability relative to untreated control cells. Data represent the mean ± SD of three independent experiments (aP < 0.05 vs wild-type cells). B, C: Early apoptotic changes (B) and late apoptotic or necrotic changes (C) were determined by annexin V apoptosis assays at 3 or 6 h after laser irradiation. Data are expressed as a percentage of annexin V-positive and PI-negative (B) or annexin V-positive and PI-positive cells (C). Data represent the mean ± SD of three independent experiments (bP < 0.05 vs wild-type cells). D: Cell cycle distributions were determined by flow cytometry at 3 or 6 h after laser irradiation. Data are expressed as a percentage of sub-G1 fraction. E: Morphological changes in response to ATX-S10Na(II)-PDT were determined by transmission electron microscopy assays at 3 or 6 h following laser irradiation. Typical subcellular changes in response to PDT are shown (original magnification × 12 000). Scale bar: 15 μm, N: nuclei.
Figure 2 Induction of apoptosis by ATX-S10Na (II)-PDT was caspase-dependent.
Cells were treated with, or without, ATX-S10Na (II)-PDT, harvested and lysed at 6 h after laser irradiation. Induction of caspase activity was assayed. A: caspase-3; B: caspase-8; C: caspase-9. Data represent the mean ± SD of three independent experiments (aP < 0.05 vs wild-type cells).
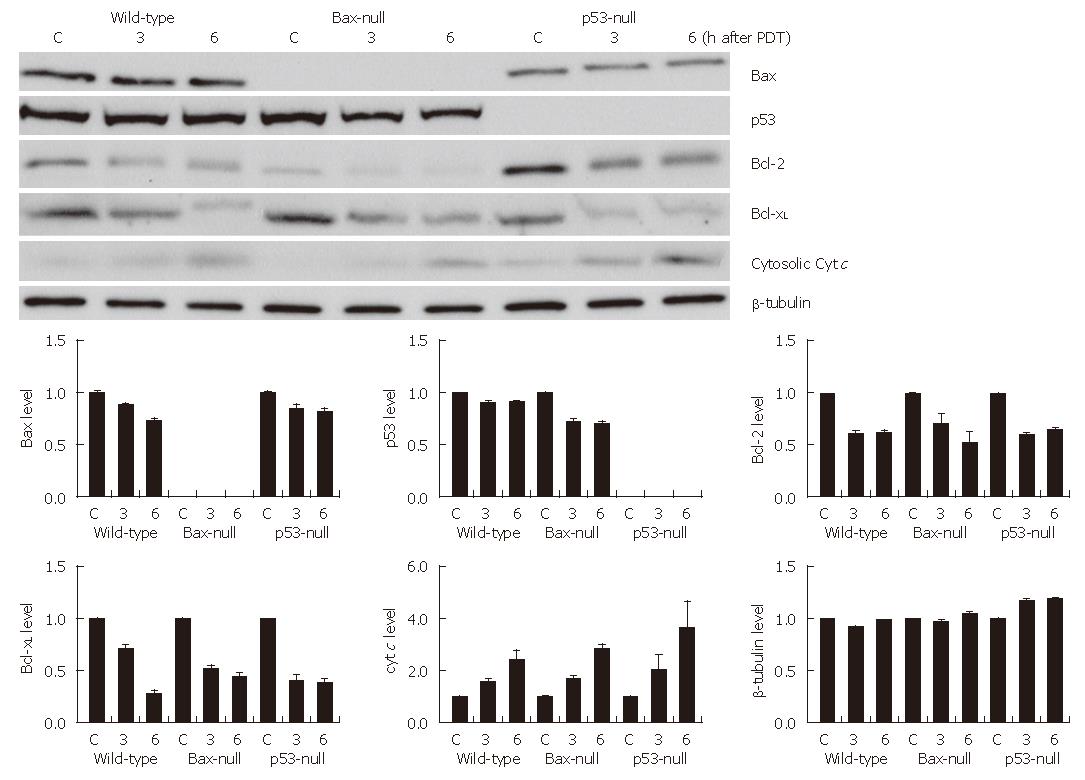
Figure 3 Low levels of Bcl-2 and Bcl-xL played a role in ATX-S10Na(II)-PDT.
Cells were treated with, or without, ATX-S10Na(II)-PDT, harvested and lysed at 3 or 6 h after laser irradiation. Western blot analysis was performed. Each protein level was quantified by using NIH Image J program. Data represent the mean ± SD of three independent experiments.
- Citation: Mitsunaga M, Tsubota A, Nariai K, Namiki Y, Sumi M, Yoshikawa T, Fujise K. Early apoptosis and cell death induced by ATX-S10Na (II)-mediated photodynamic therapy are Bax- and p53-dependent in human colon cancer cells. World J Gastroenterol 2007; 13(5): 692-698
- URL: https://www.wjgnet.com/1007-9327/full/v13/i5/692.htm
- DOI: https://dx.doi.org/10.3748/wjg.v13.i5.692


