Copyright
©2007 Baishideng Publishing Group Inc.
World J Gastroenterol. Dec 21, 2007; 13(47): 6396-6403
Published online Dec 21, 2007. doi: 10.3748/wjg.v13.i47.6396
Published online Dec 21, 2007. doi: 10.3748/wjg.v13.i47.6396
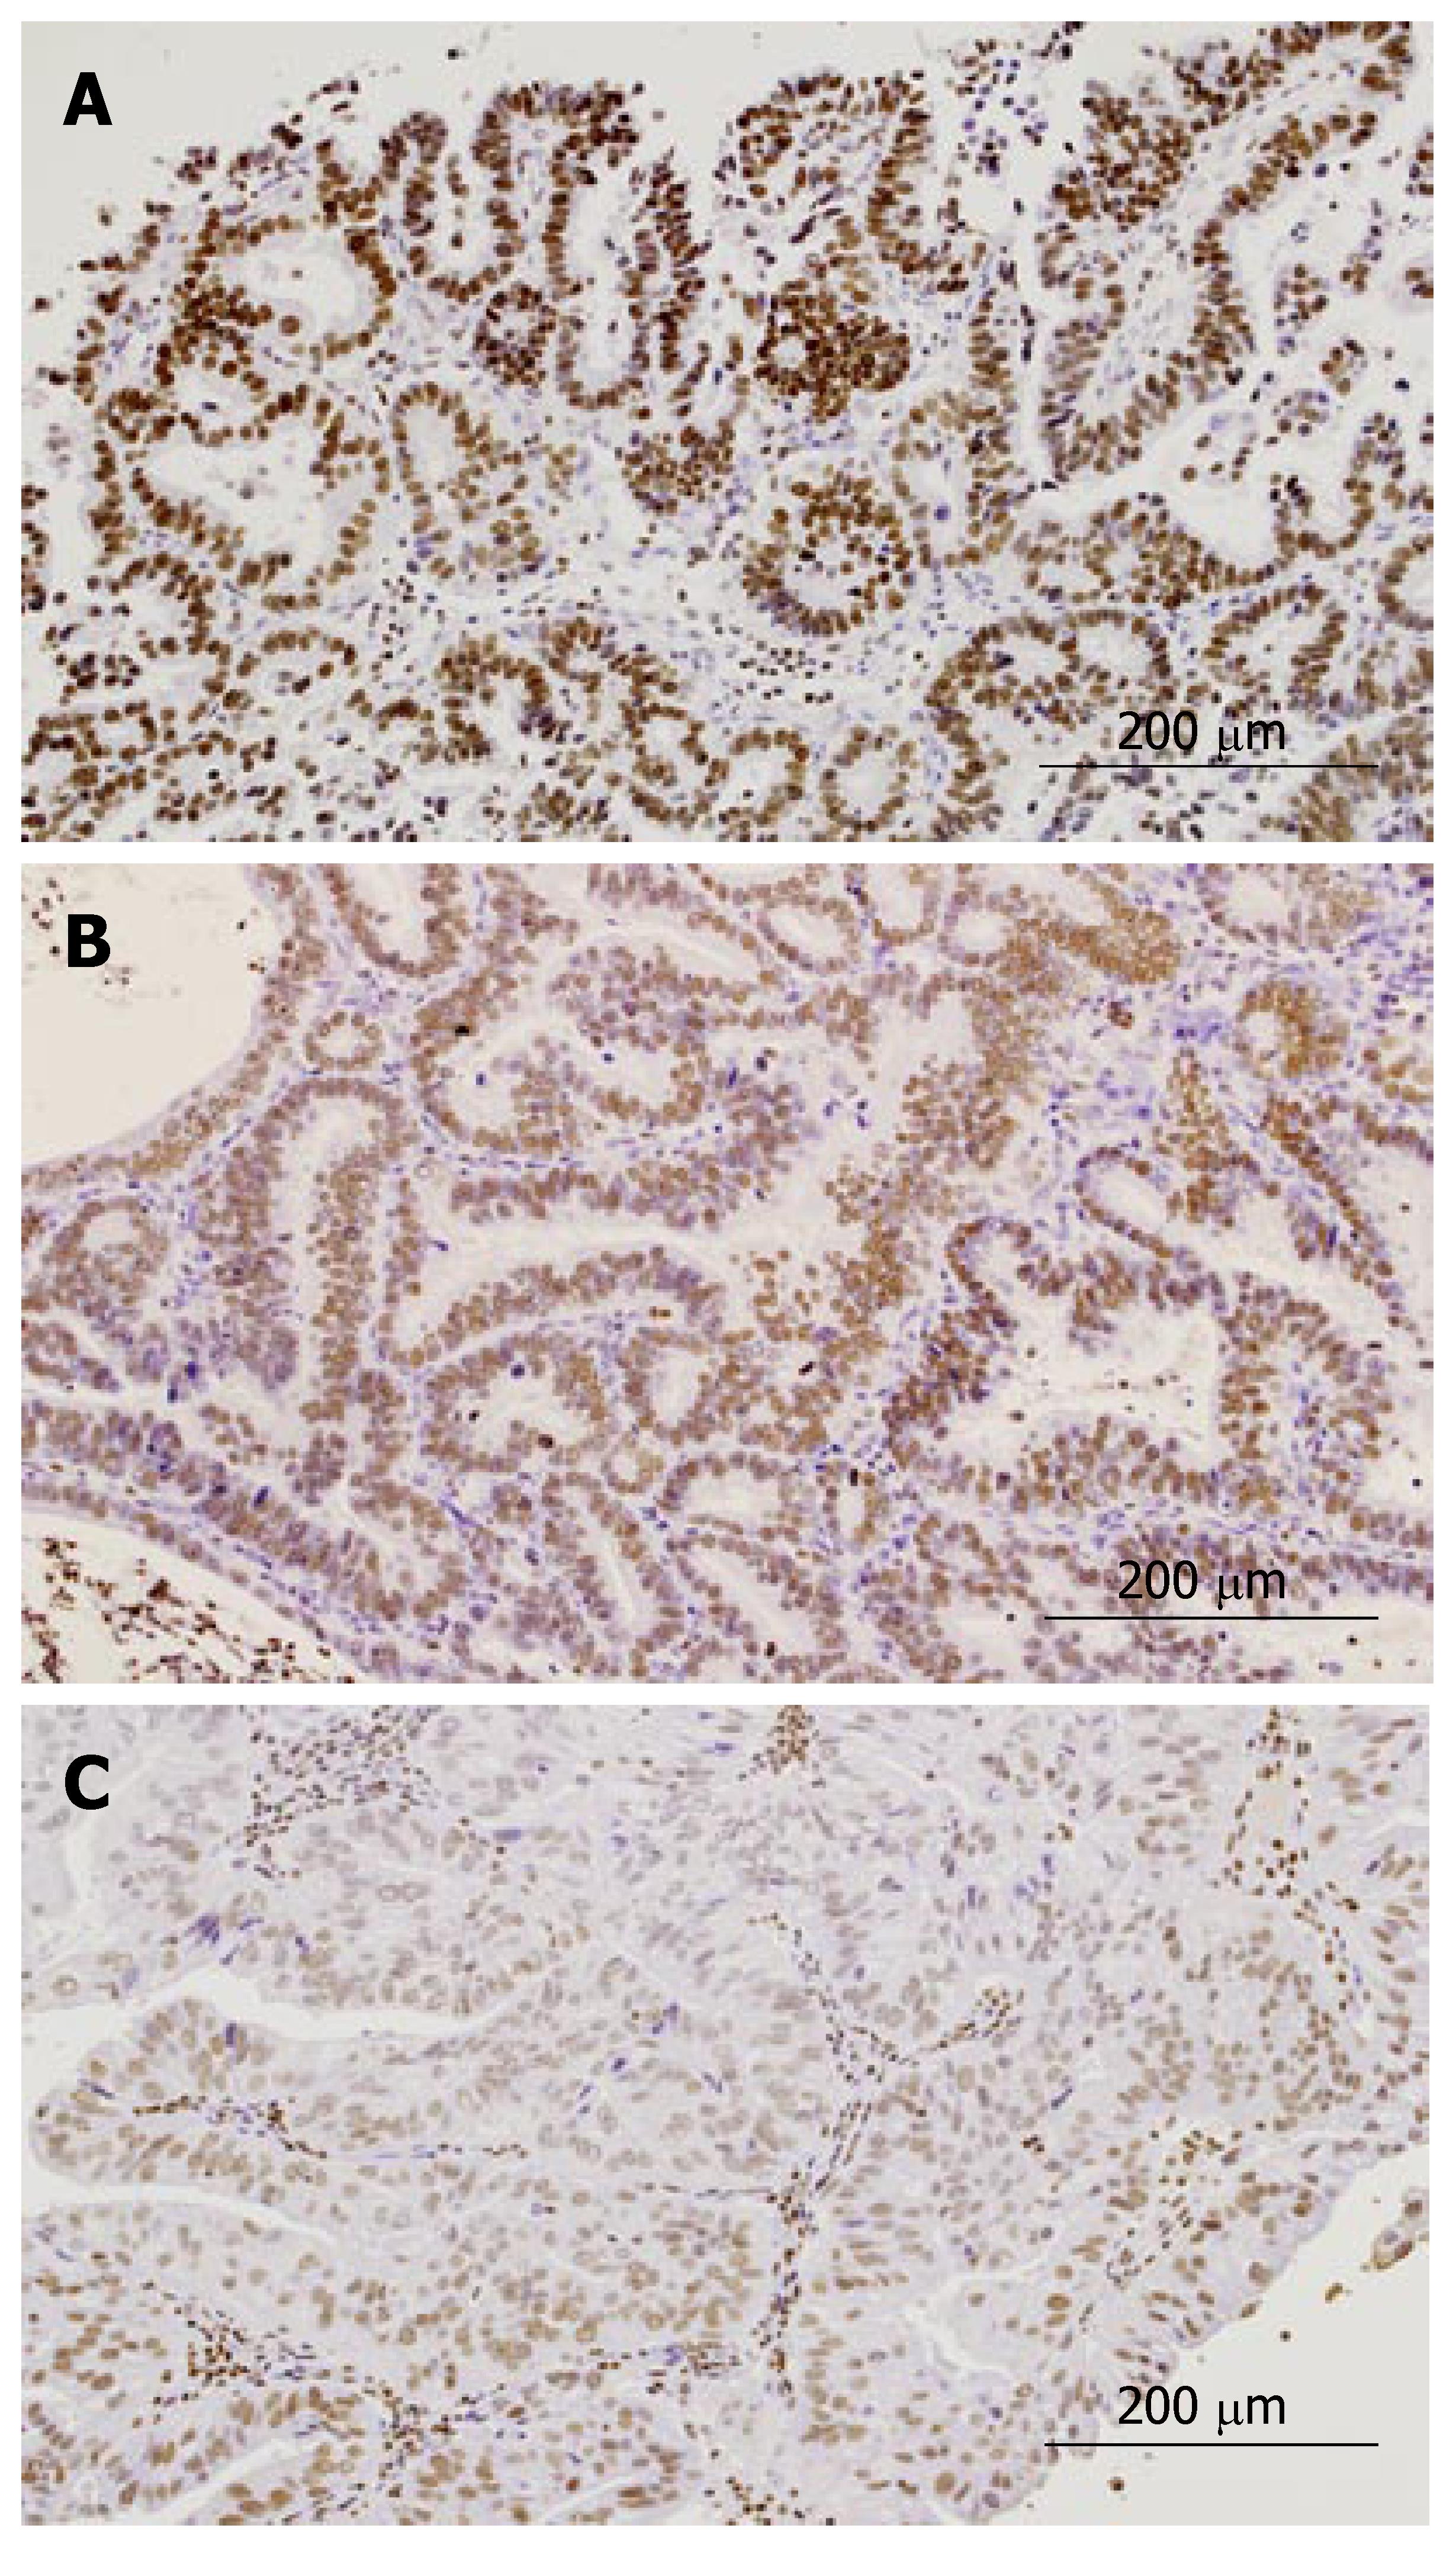
Figure 1 Immunohistochemical staining of p16.
A: Tumor cells showing diffuse strong positive staining of p16; B: Tumor cells showing diffuse moderate staining; C: Tumor cells showing partly weak staining.
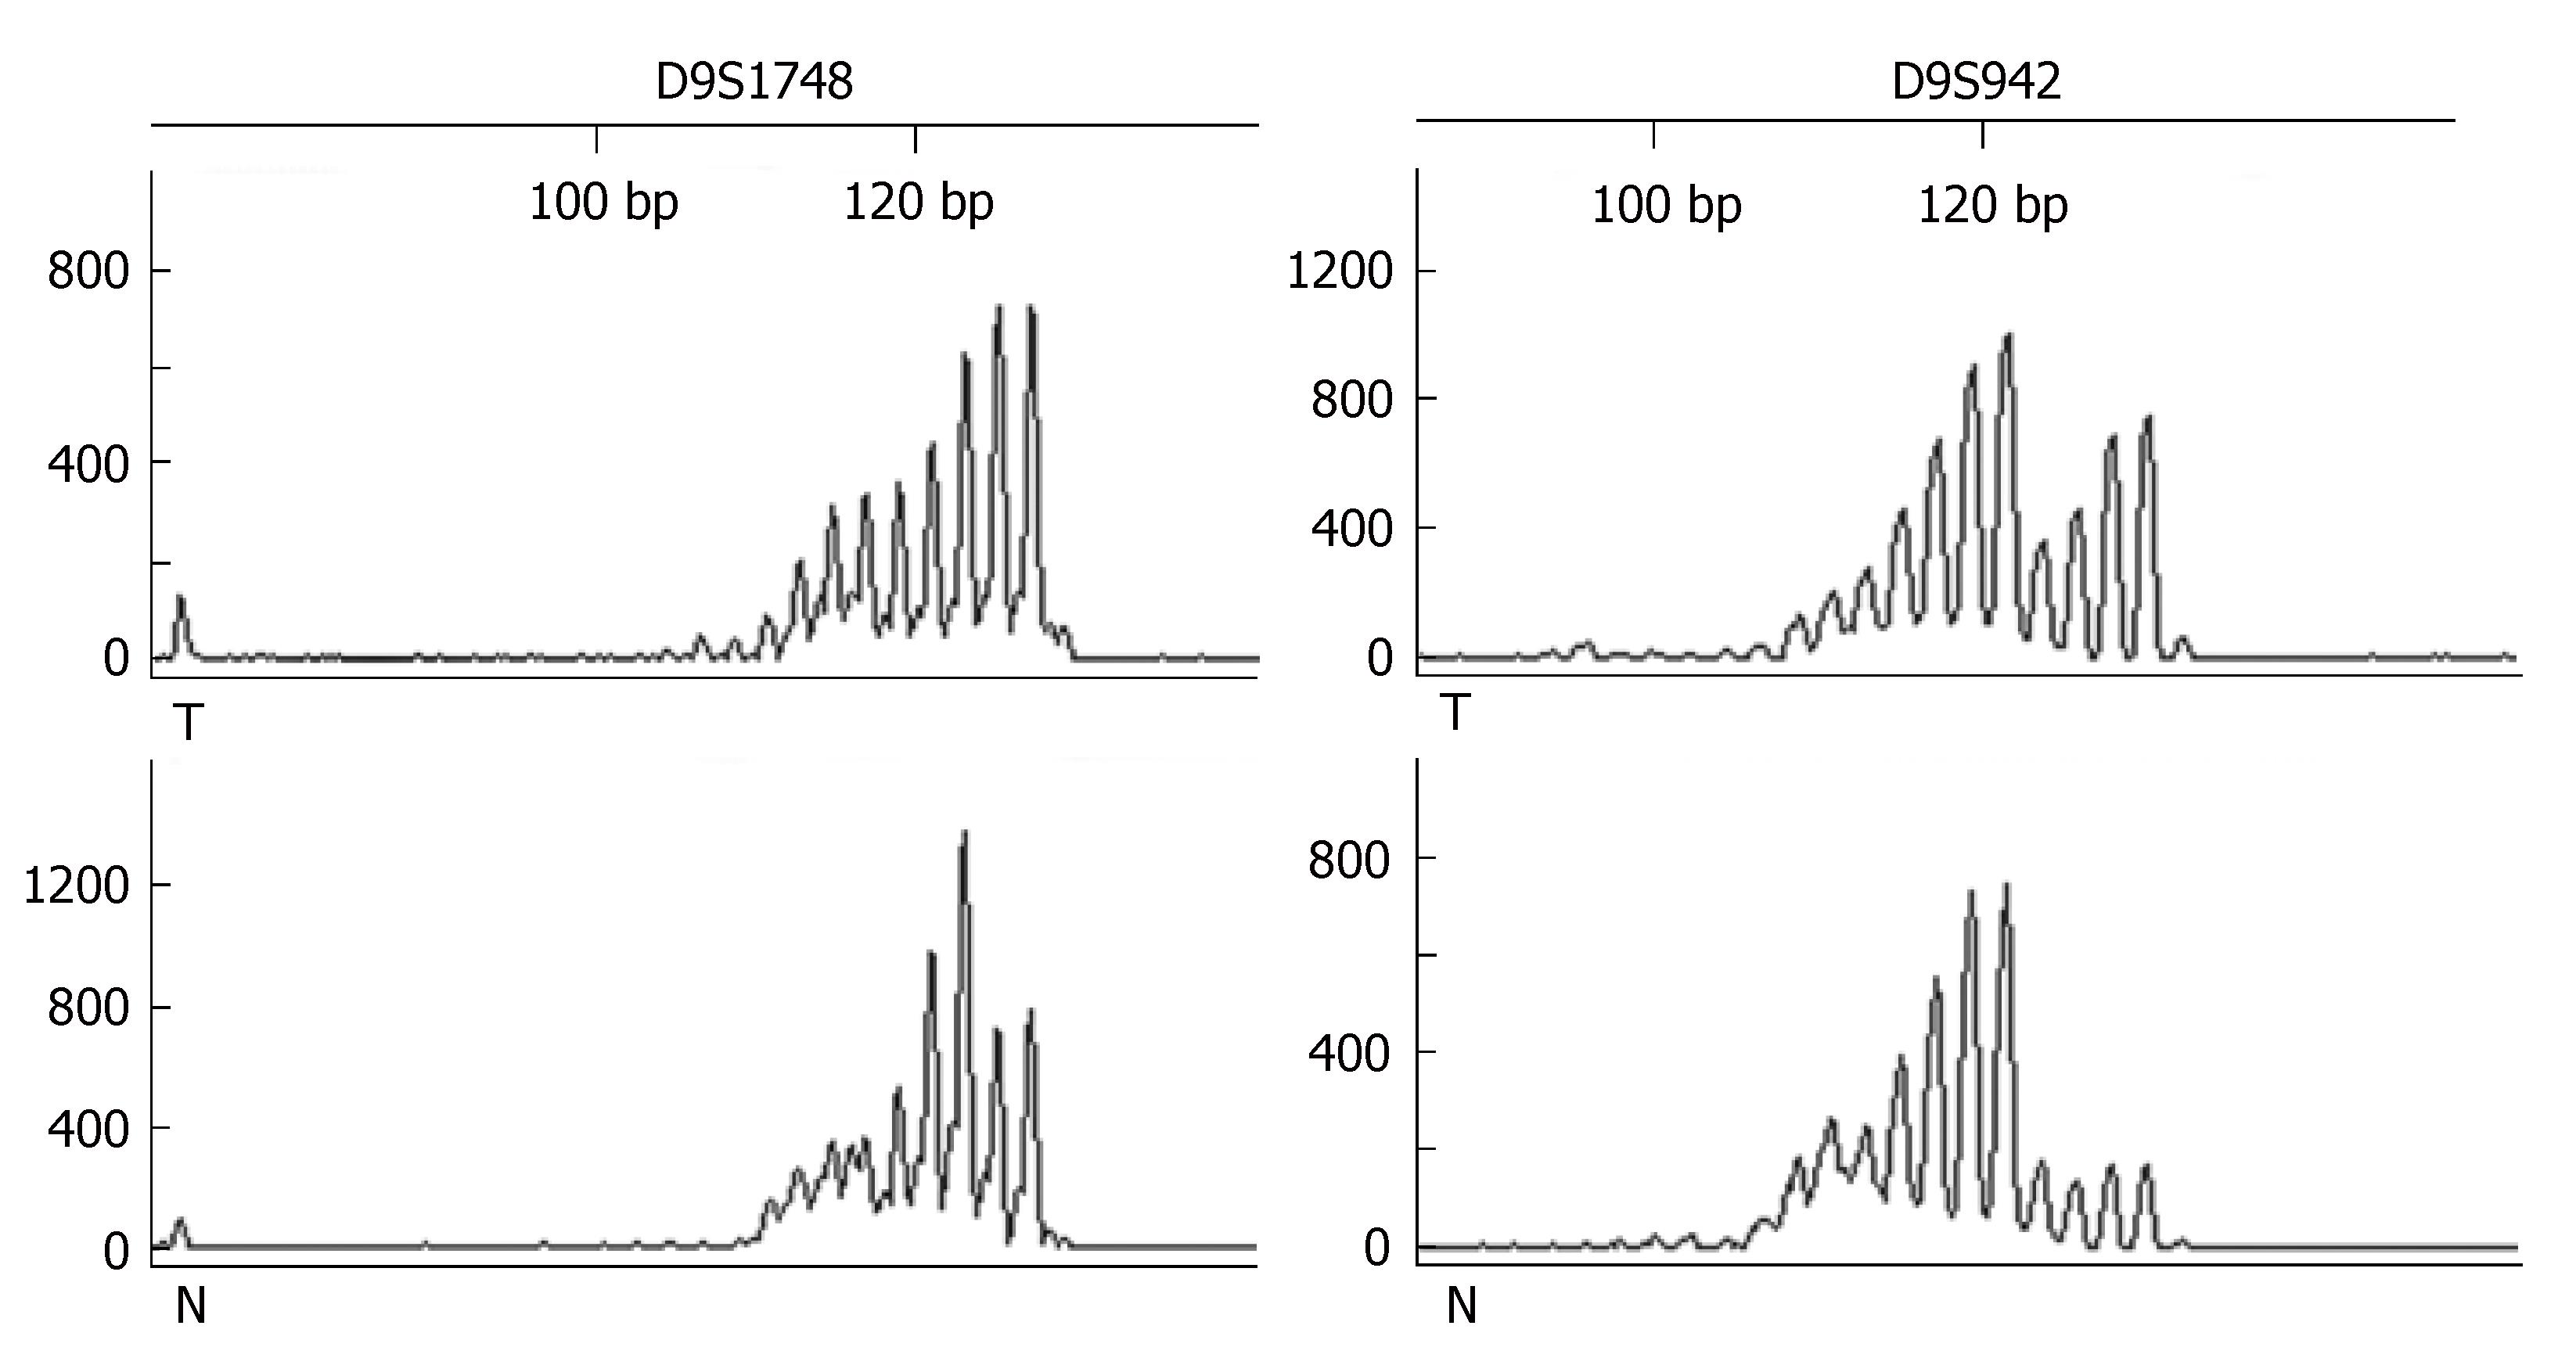
Figure 2 Representative example of the results of microsatellite analysis showing LOH at D9S1748 and LOH at D9S942 (right, case 25; left, case 45).
The scales on the top and left side of each figure represent the size (bp) and the intensity, respectively. N: Normal; T: Tumor.
Figure 3 Methylation status of the p16INK4a gene by methylation-specific PCR.
PCR products amplified by unmethylated (U) and methylated (M) specific primers. P: Positive control; N: Negative control. Methyaltion band is at 150 bp and unmethylated band is at 234 bp.
- Citation: Tadokoro H, Shigihara T, Ikeda T, Takase M, Suyama M. Two distinct pathways of p16 gene inactivation in gallbladder cancer. World J Gastroenterol 2007; 13(47): 6396-6403
- URL: https://www.wjgnet.com/1007-9327/full/v13/i47/6396.htm
- DOI: https://dx.doi.org/10.3748/wjg.v13.i47.6396


