Copyright
©2007 Baishideng Publishing Group Inc.
World J Gastroenterol. Dec 14, 2007; 13(46): 6243-6248
Published online Dec 14, 2007. doi: 10.3748/wjg.v13.i46.6243
Published online Dec 14, 2007. doi: 10.3748/wjg.v13.i46.6243
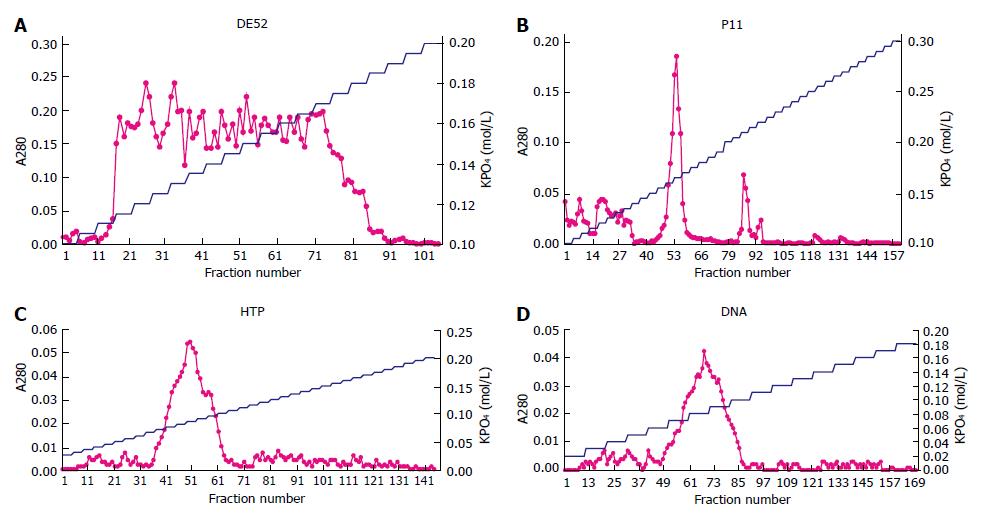
Figure 1 A280 and gradient concentration of KPO4 in each chromatography.
The curve with spots is for A280, the other is for KPO4. A: A broad peak of protein from the 16th tube (0.115 mol/L) to the 90th tube (0.185 mol/L), clearly observed in the second DE52 chromatography; B: Phosphocellulose chromatography displaying a major peak of protein identified at 0.165 mol/L KPO4 and a minor trailing shoulder at 0.21 mol/L; C: Hydroxylapatite chromatography showing a single sharp peak of protein at 0.085 mol/L KPO4; D: DNA-cellulose chromatography revealing a single sharp peak at 0.085 mol/L KPO4.
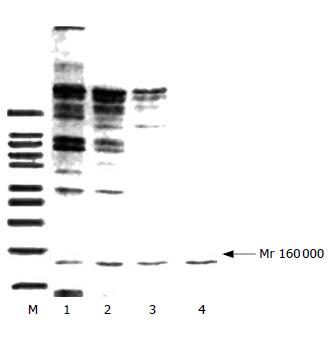
Figure 2 SDS-PAGE displaying decreased bands after purification steps-DE52 (lane 1), P11 (lane 2), HTP (lane 3) and DNA (lane4), and M (marker), While DNA-cellulose chromatography demonstrating only one band (Mr 160 000).
Figure 3 Western blot of the fractions of DNA-cellulose chromatography.
When mouse anti-human DNA polymerase α monocloned antibody was used as the primary antibody, the fraction was found to be DNA polymerase α.
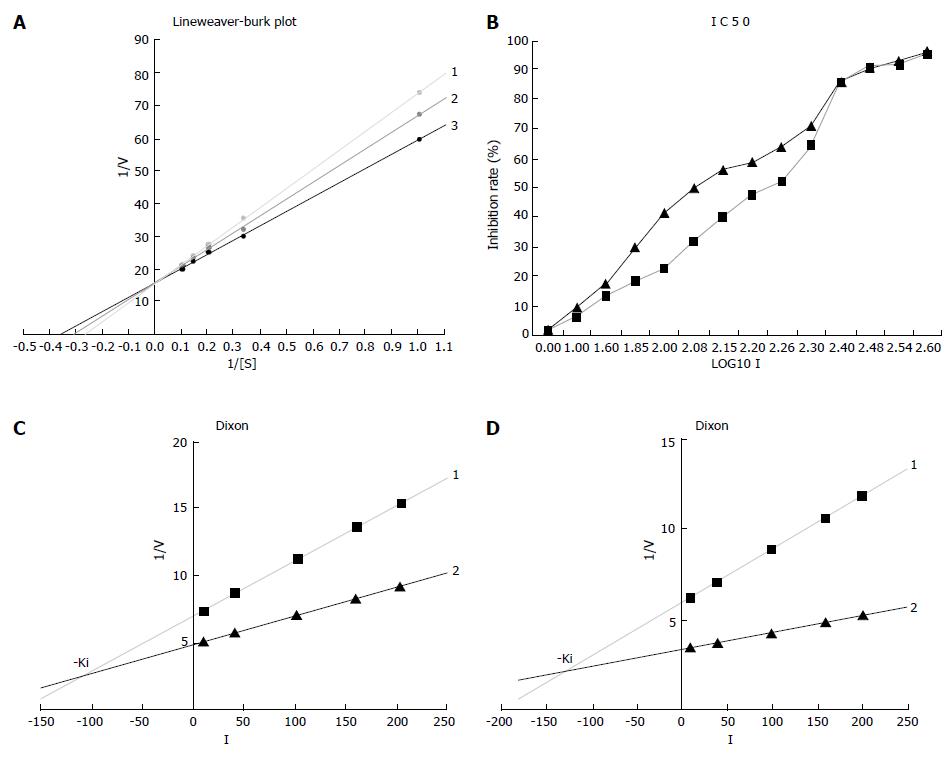
Figure 4 Determination of detailed kinetic parameters Km (A), IC50 (B), and Ki (C for 3TC, D for β-L-D4A).
- Citation: Li Y, Lin JS, Zhang YH, Wang XY, Chang Y, He XX. Effect and mechanism of β-L-D4A on DNA polymerase α. World J Gastroenterol 2007; 13(46): 6243-6248
- URL: https://www.wjgnet.com/1007-9327/full/v13/i46/6243.htm
- DOI: https://dx.doi.org/10.3748/wjg.v13.i46.6243


