Copyright
©2007 Baishideng Publishing Group Inc.
World J Gastroenterol. Nov 14, 2007; 13(42): 5612-5617
Published online Nov 14, 2007. doi: 10.3748/wjg.v13.i42.5612
Published online Nov 14, 2007. doi: 10.3748/wjg.v13.i42.5612
Figure 1 Representative HE-stained pancreatic tissue from the rats (original magnification × 40) in the control group (A), AP group (B) and artemisinin-treated group (C).
Figure 2 Isolated pancreatic acinar cells stained with AO and EB, and scanned under confocal laser microscope (original magnification × 100) in the control group (A), AP group (B), and artemisinin-treated group (C).
Fine arrows indicate oncotic cells, and thick arrows indicate apoptotic cells.
Figure 3 Isolated pancreatic acinar cells stained with AO and EB, and observed under fluorescent microscope (original magnification × 40) in the control group (A), AP group (B), and artemisinin-treated group (C).
Fine arrows indicate oncotic cells, and thick arrows indicate apoptotic cells.
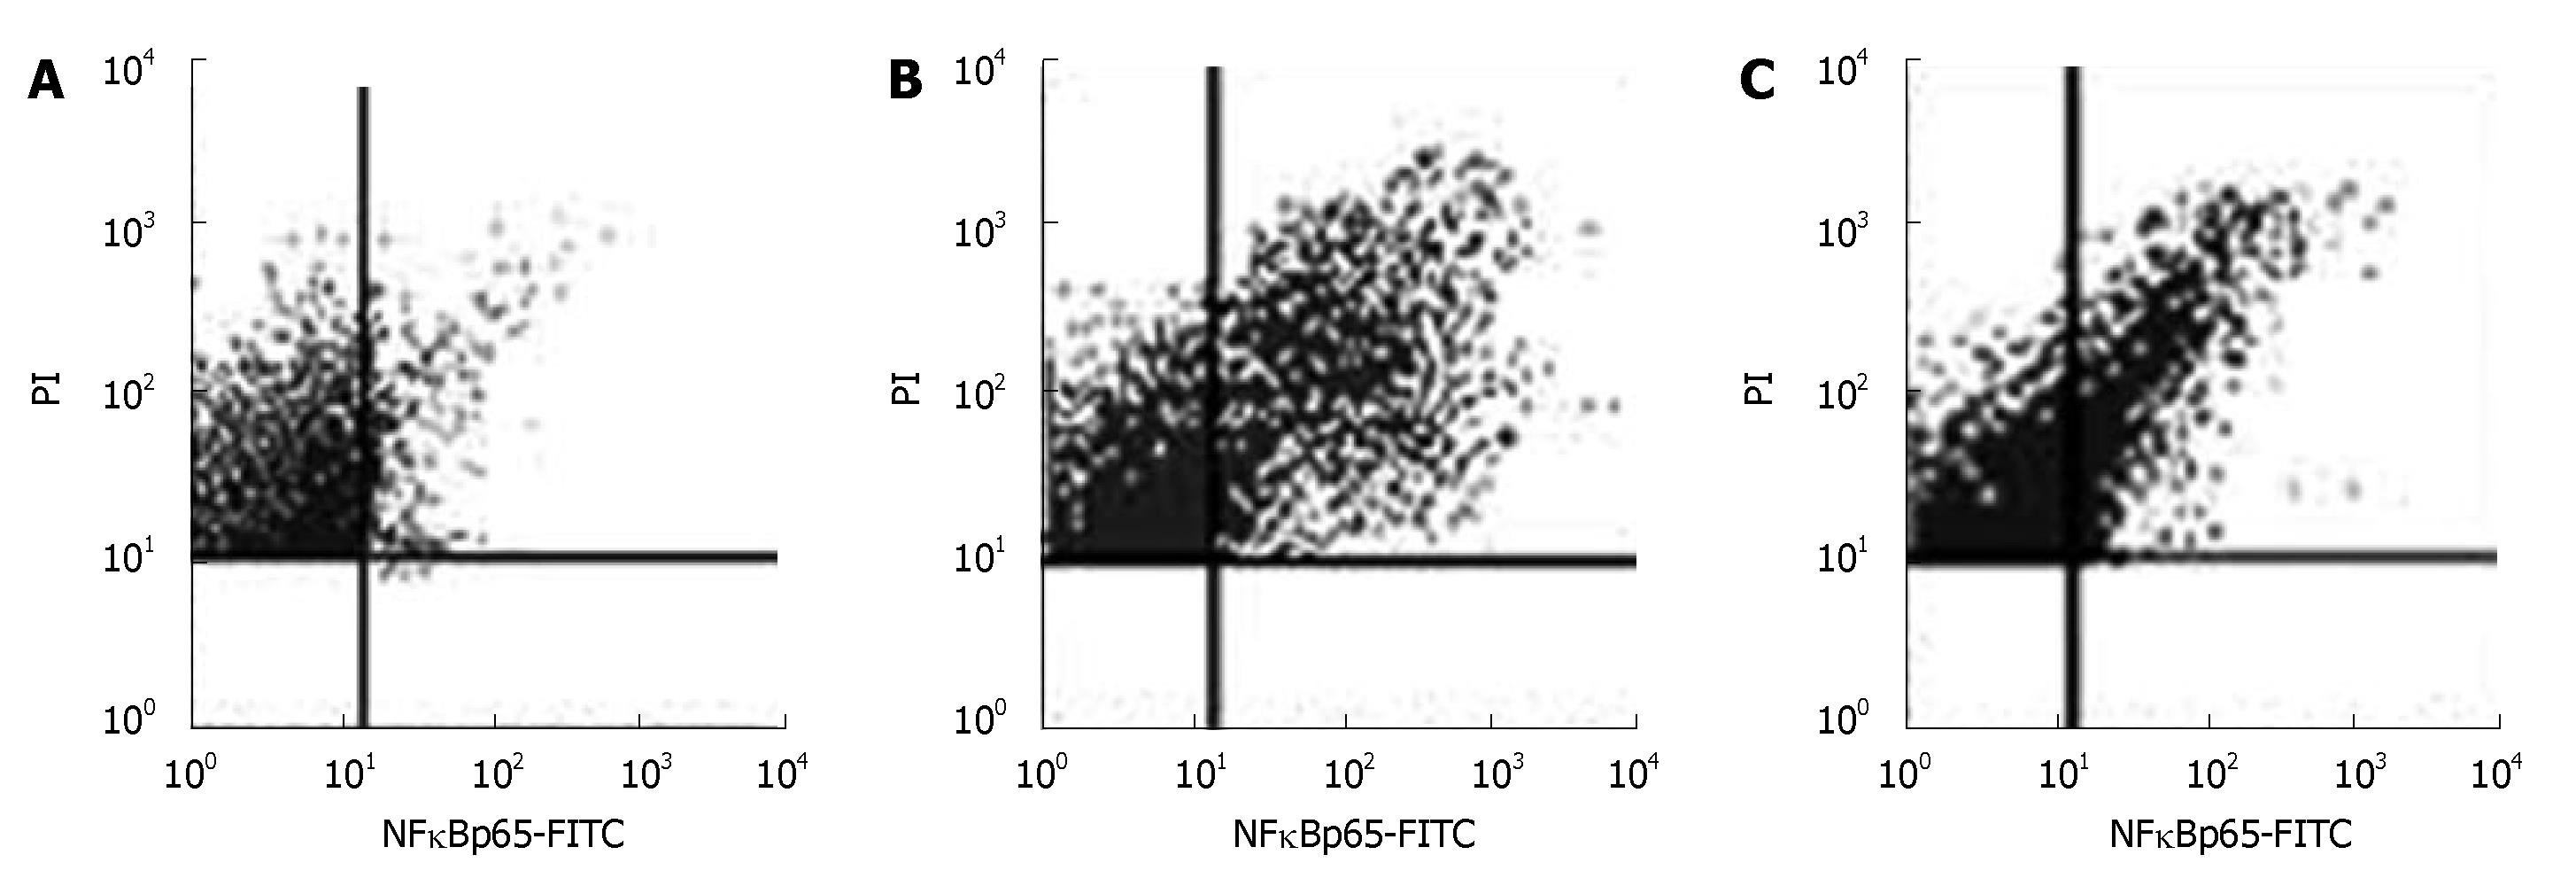
Figure 4 Flow cytometric analysis of NF-κB activation in the control group (A), AP group (B), and artemisinin-treated group (C).
Figure 5 MIP-1α measured by Western blot and IL-1β mRNA detected by RT-PCR in the control group (A), AP group (B), and artemisinin -treated group (C).
- Citation: Zhao M, Xue DB, Zheng B, Zhang WH, Pan SH, Sun B. Induction of apoptosis by artemisinin relieving the severity of inflammation in caerulein-induced acute pancreatitis. World J Gastroenterol 2007; 13(42): 5612-5617
- URL: https://www.wjgnet.com/1007-9327/full/v13/i42/5612.htm
- DOI: https://dx.doi.org/10.3748/wjg.v13.i42.5612


