Copyright
©2007 Baishideng Publishing Group Inc.
World J Gastroenterol. Nov 7, 2007; 13(41): 5440-5445
Published online Nov 7, 2007. doi: 10.3748/wjg.v13.i41.5440
Published online Nov 7, 2007. doi: 10.3748/wjg.v13.i41.5440
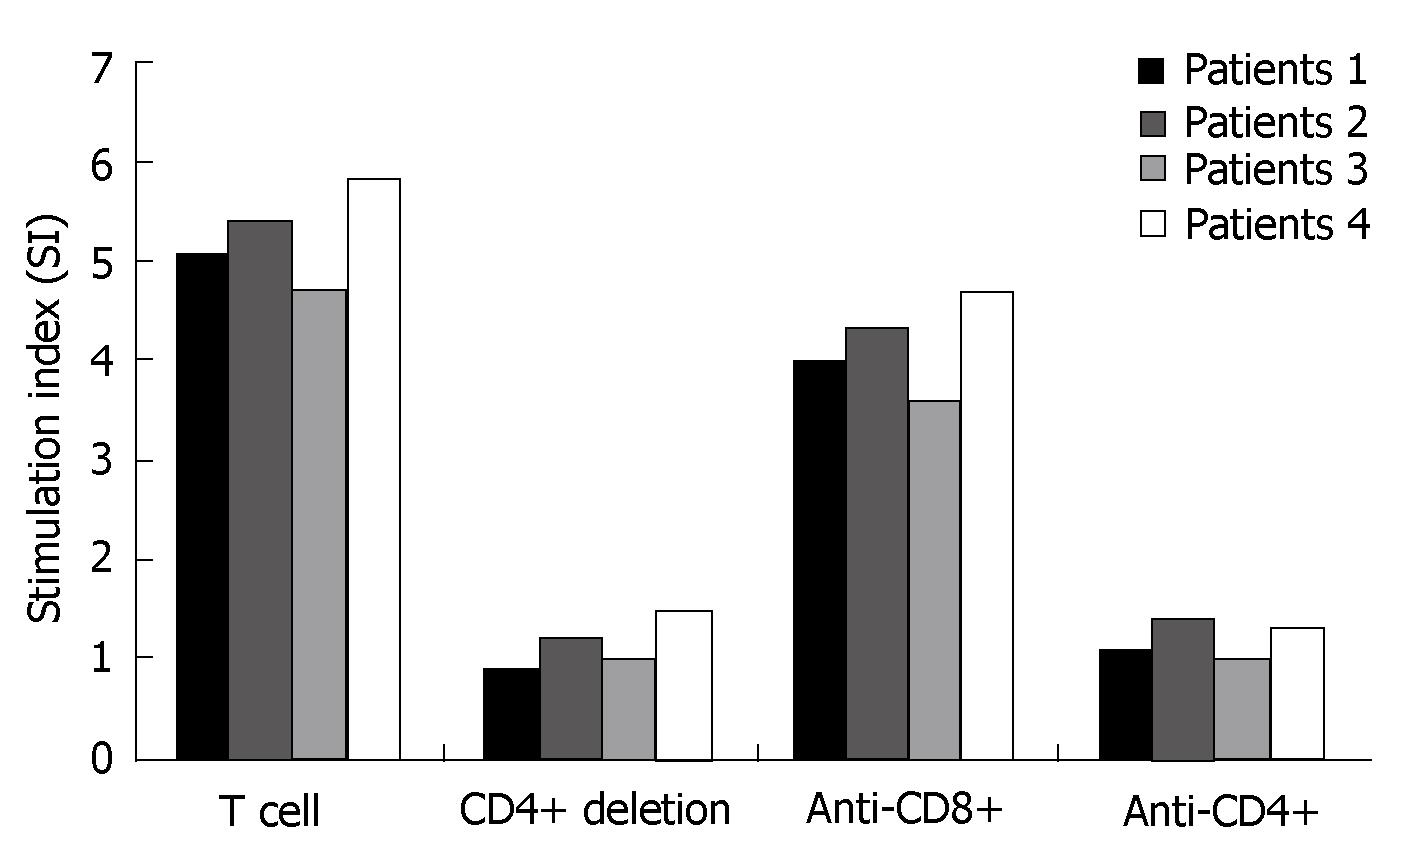
Figure 1 Abrogation of antigen-specific T-cell proliferative responses from patients 1-4 at 12 mo (bP < 0.
01 vs T cell and Anti CD8+).
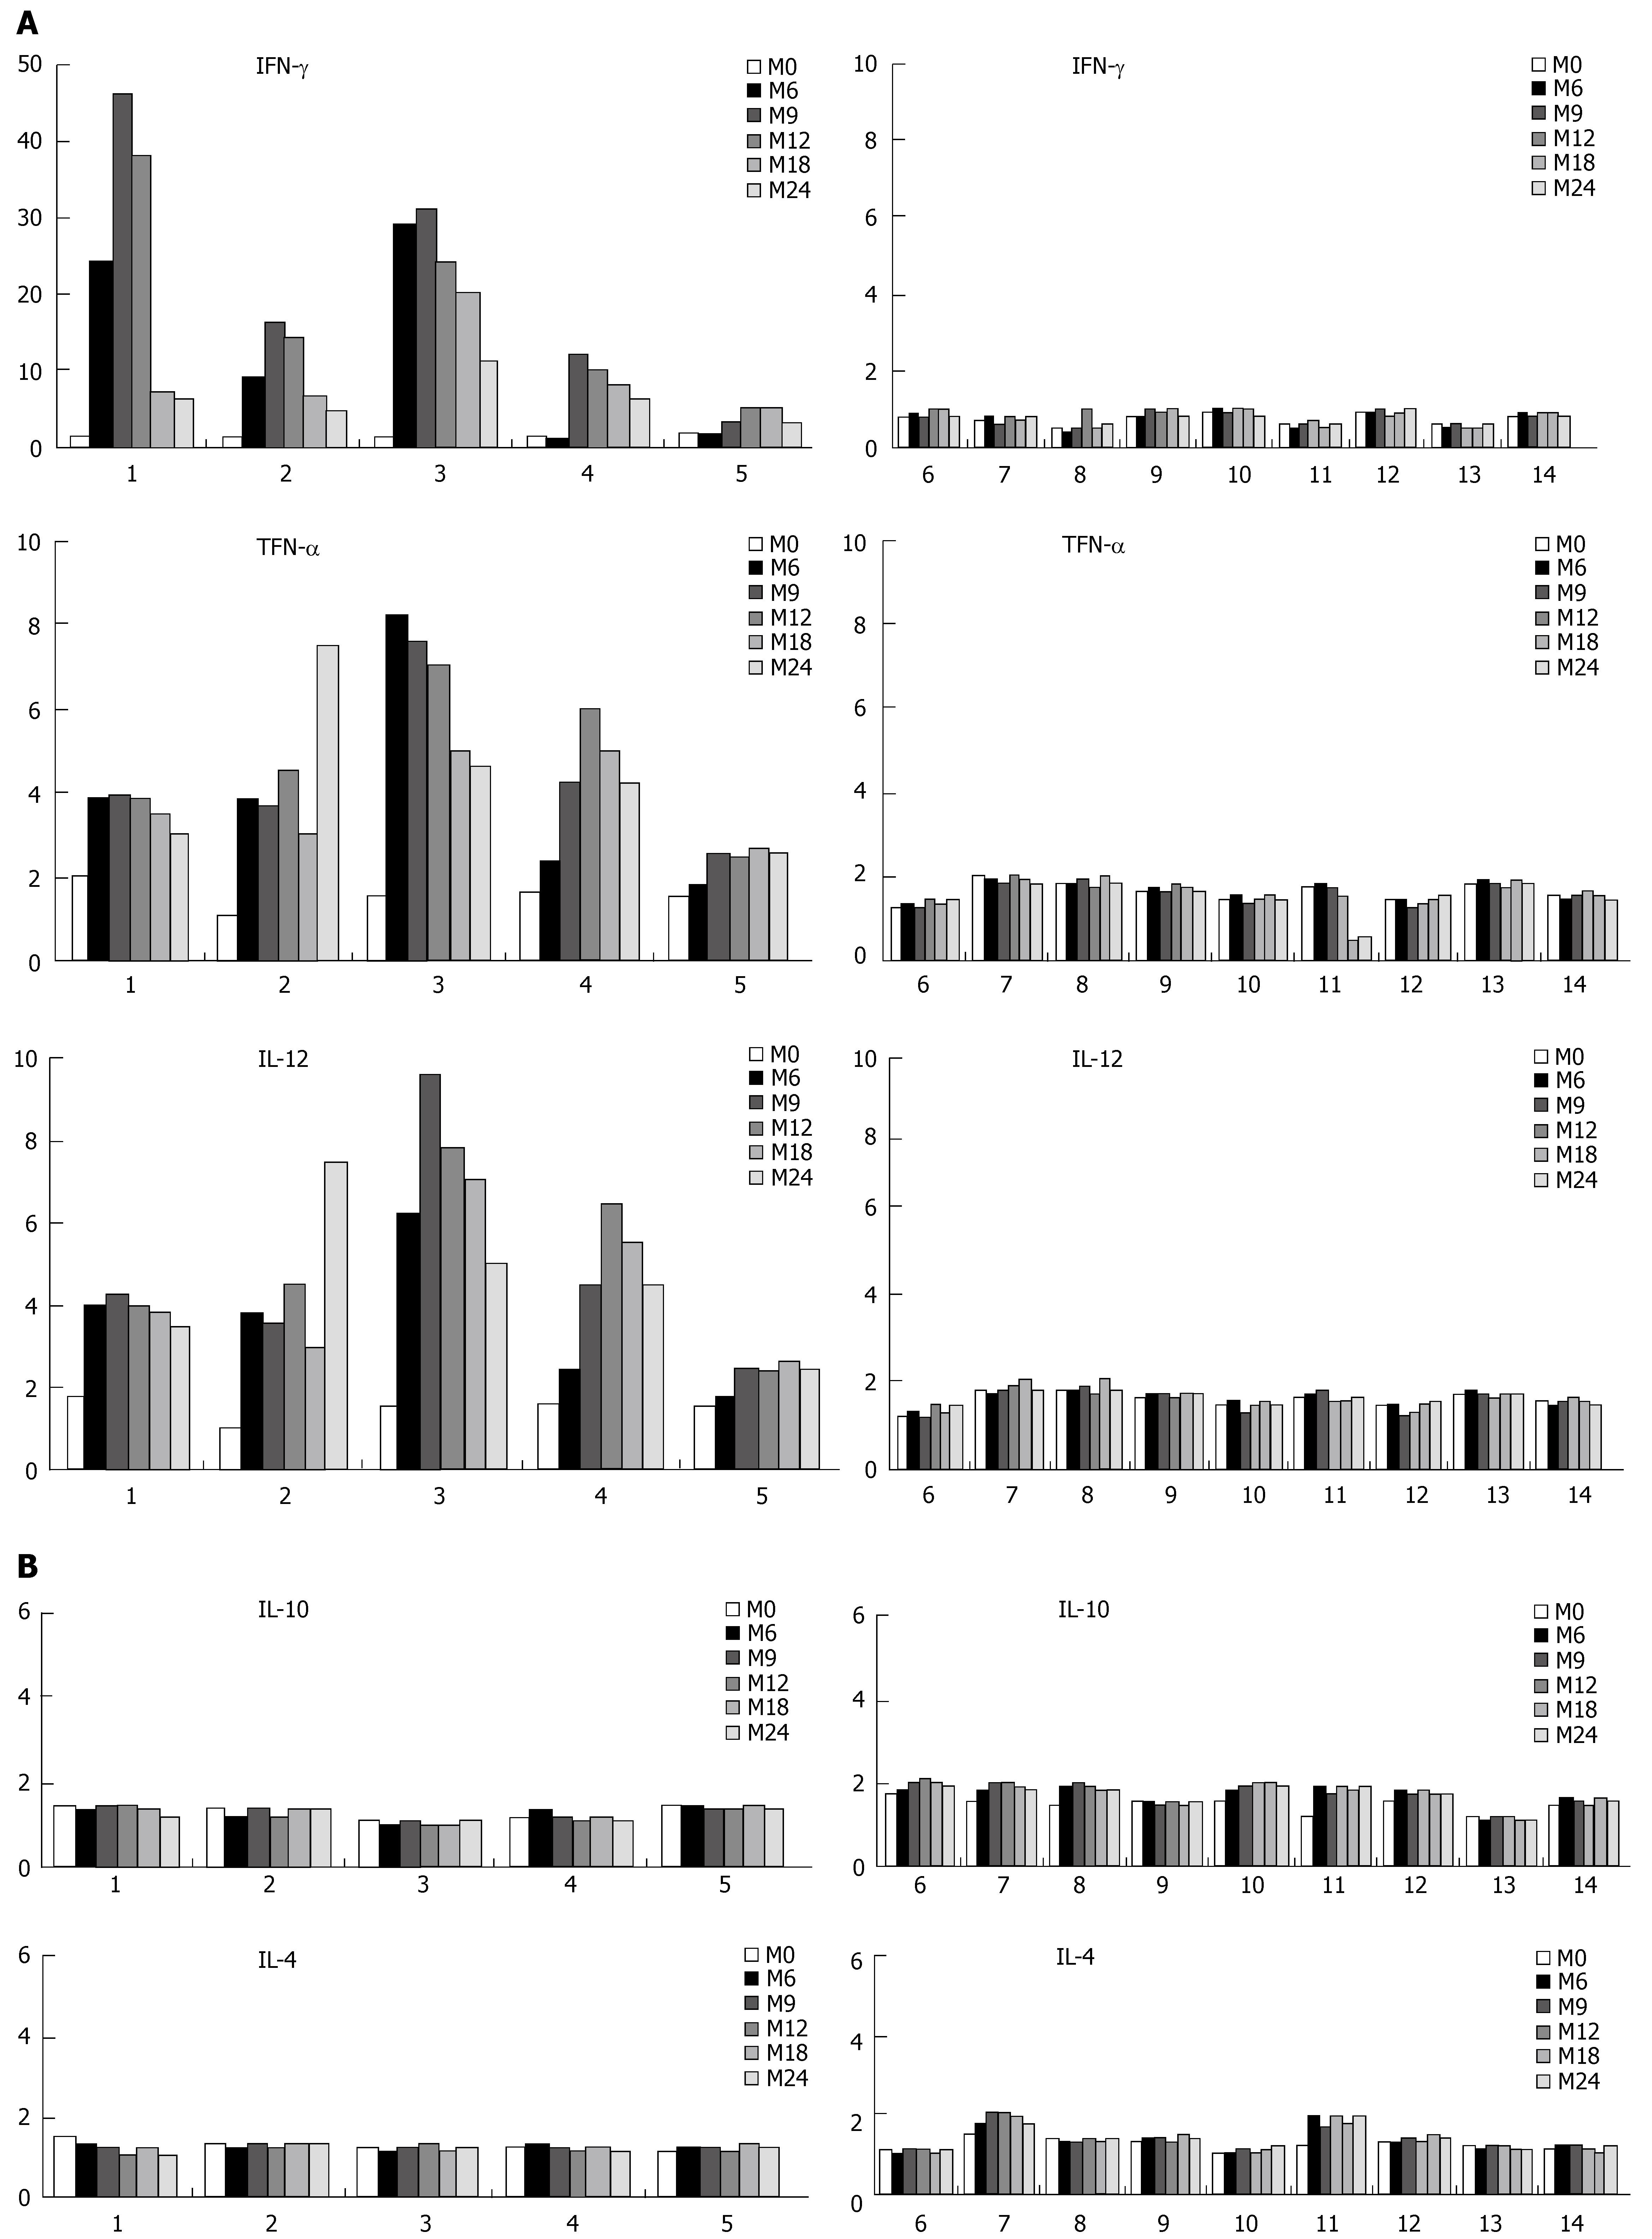
Figure 2 Cytokine production levels in PBMCs in combination therapy patients.
The vertical axis represents the ratio of the mean cytokine concentration of triplicate cultures obtained in the presence of antigen to that obtained without antigen. The numbers in the horizontal lines represent the patients. A: Th1 cytokine production in PBMCs in combination therapy patients; B: Th2 cytokine production in PBMCs in combination therapy patients.
- Citation: Ren FY, Jin H, Piao XX, Piao FS. Ribavirin and IFN-α combination therapy induces CD4+ T-cell proliferation and Th1 cytokine secretion in patients with chronic hepatitis B. World J Gastroenterol 2007; 13(41): 5440-5445
- URL: https://www.wjgnet.com/1007-9327/full/v13/i41/5440.htm
- DOI: https://dx.doi.org/10.3748/wjg.v13.i41.5440


