Copyright
©2007 Baishideng Publishing Group Inc.
World J Gastroenterol. Nov 7, 2007; 13(41): 5432-5439
Published online Nov 7, 2007. doi: 10.3748/wjg.v13.i41.5432
Published online Nov 7, 2007. doi: 10.3748/wjg.v13.i41.5432
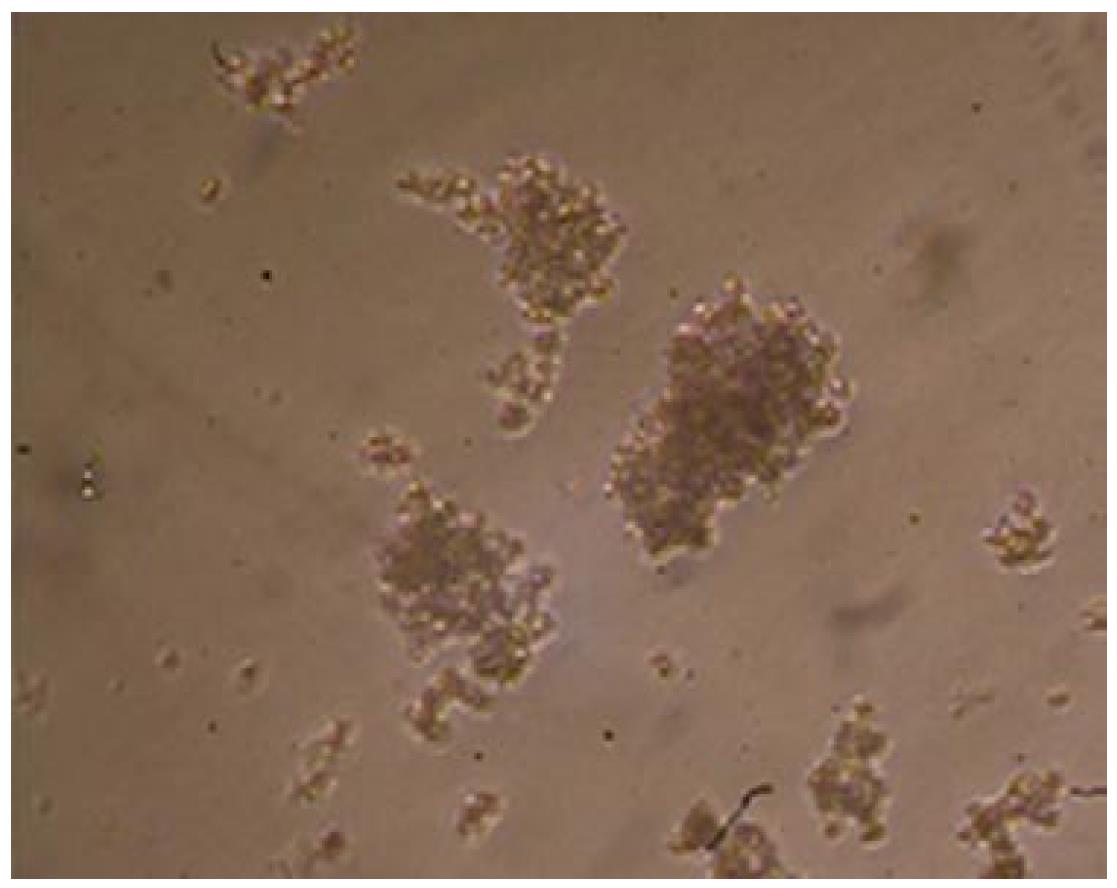
Figure 1 Multicellular spheroids of hepG2 cells observed with the phase contrast microscope (× 100).
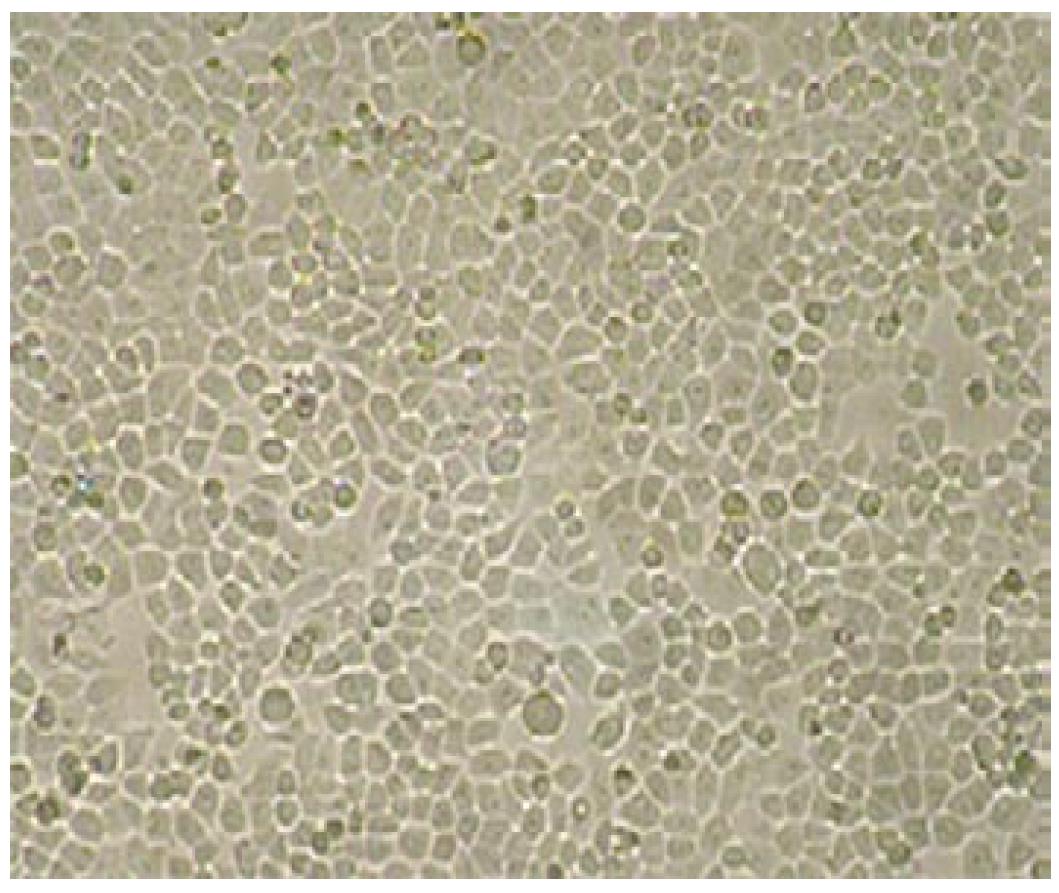
Figure 2 Monolayer of hepG2 cells observed with the phase contrast microscope (× 100).
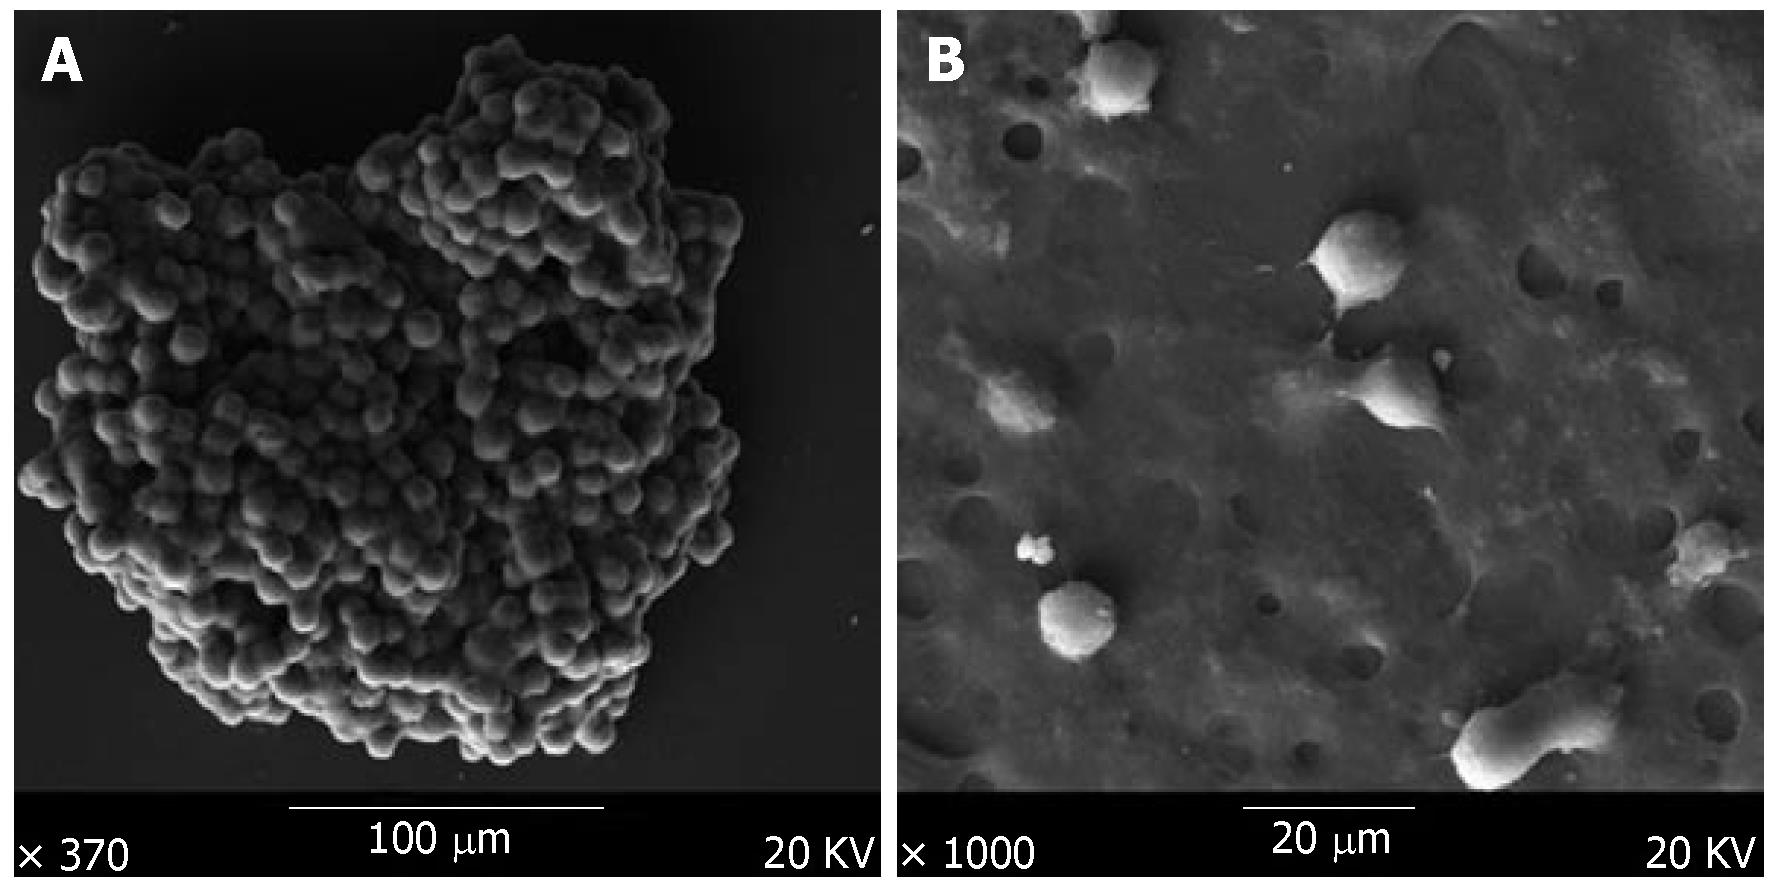
Figure 3 Scanning electron microscopy of hepG2 cells.
A: The multicellular sphere was irregular with a diameter up to 1.0-2.0 mm, tight cell junctions were observed; B: Monolayer cells spread dispersively and cell junctions were hardly observed.
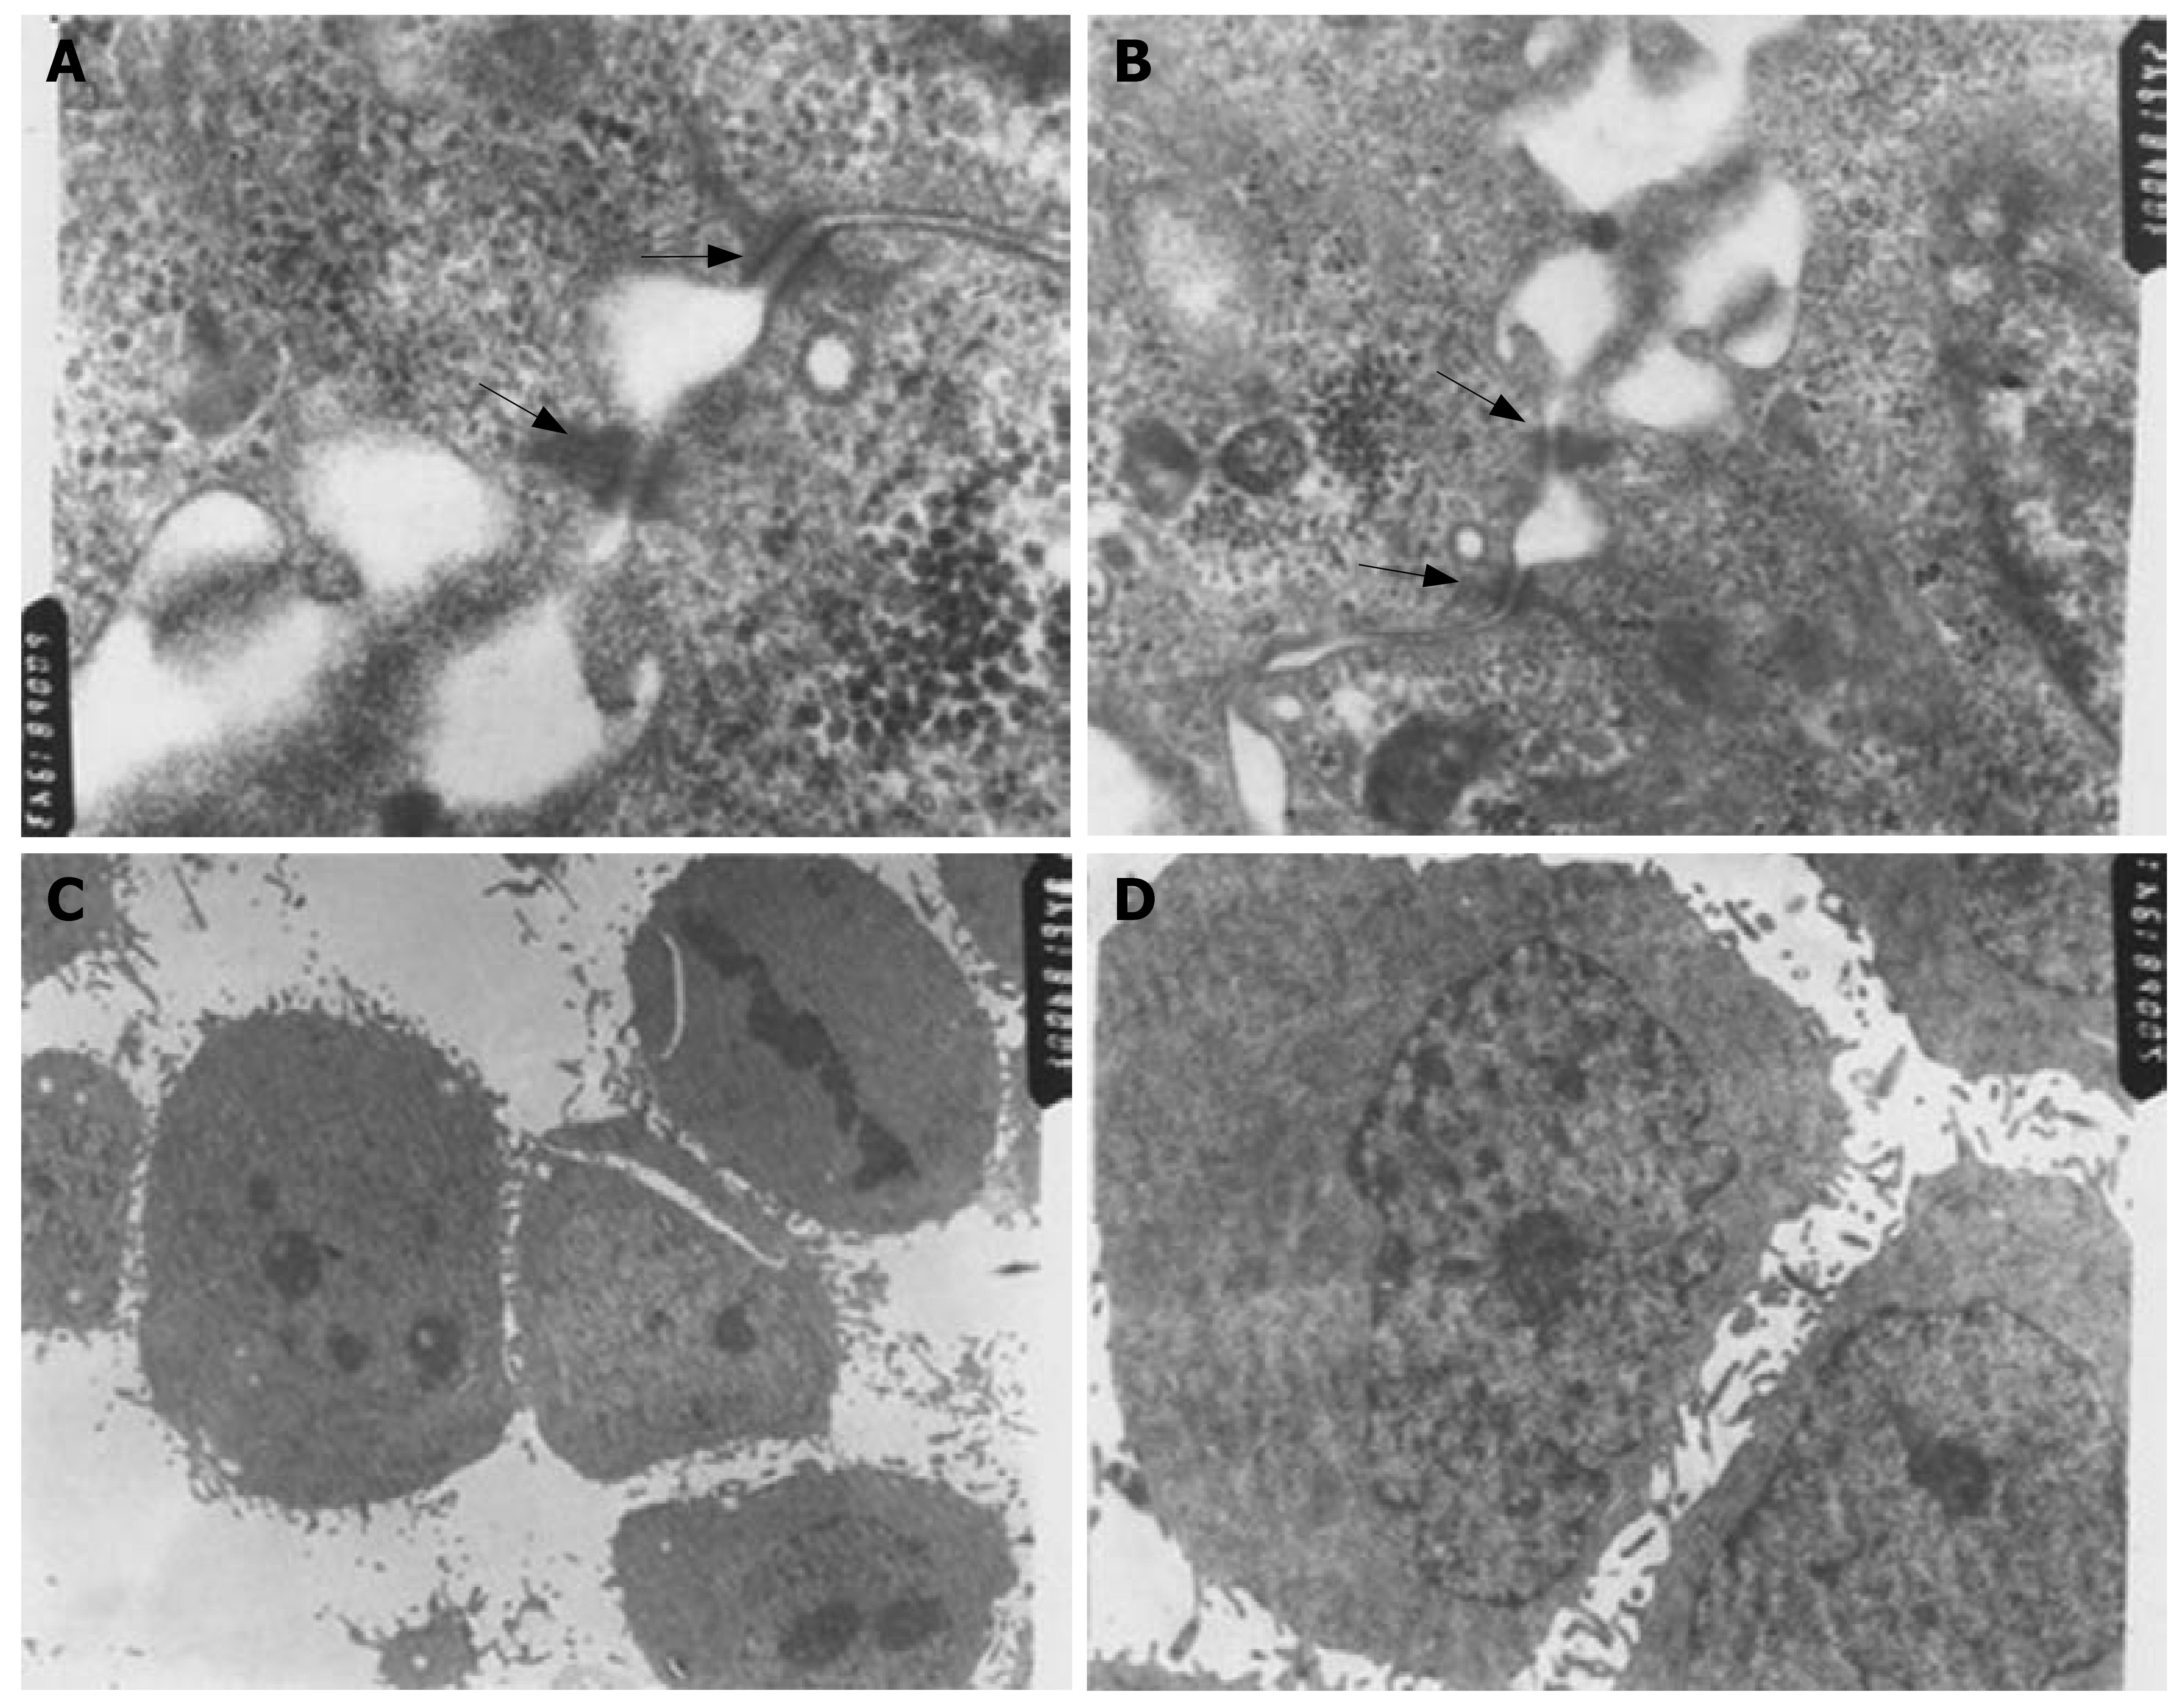
Figure 4 Transmission electron microscopy of hepG2 cells: A (× 60000); B (× 30000): desmosome junctions and intermediate junctions were observed in three-dimensional cell culture; C (× 3000); D (× 5000): cell junctions were hardly observed in monolayer cells with more microvilli on the surfaces.
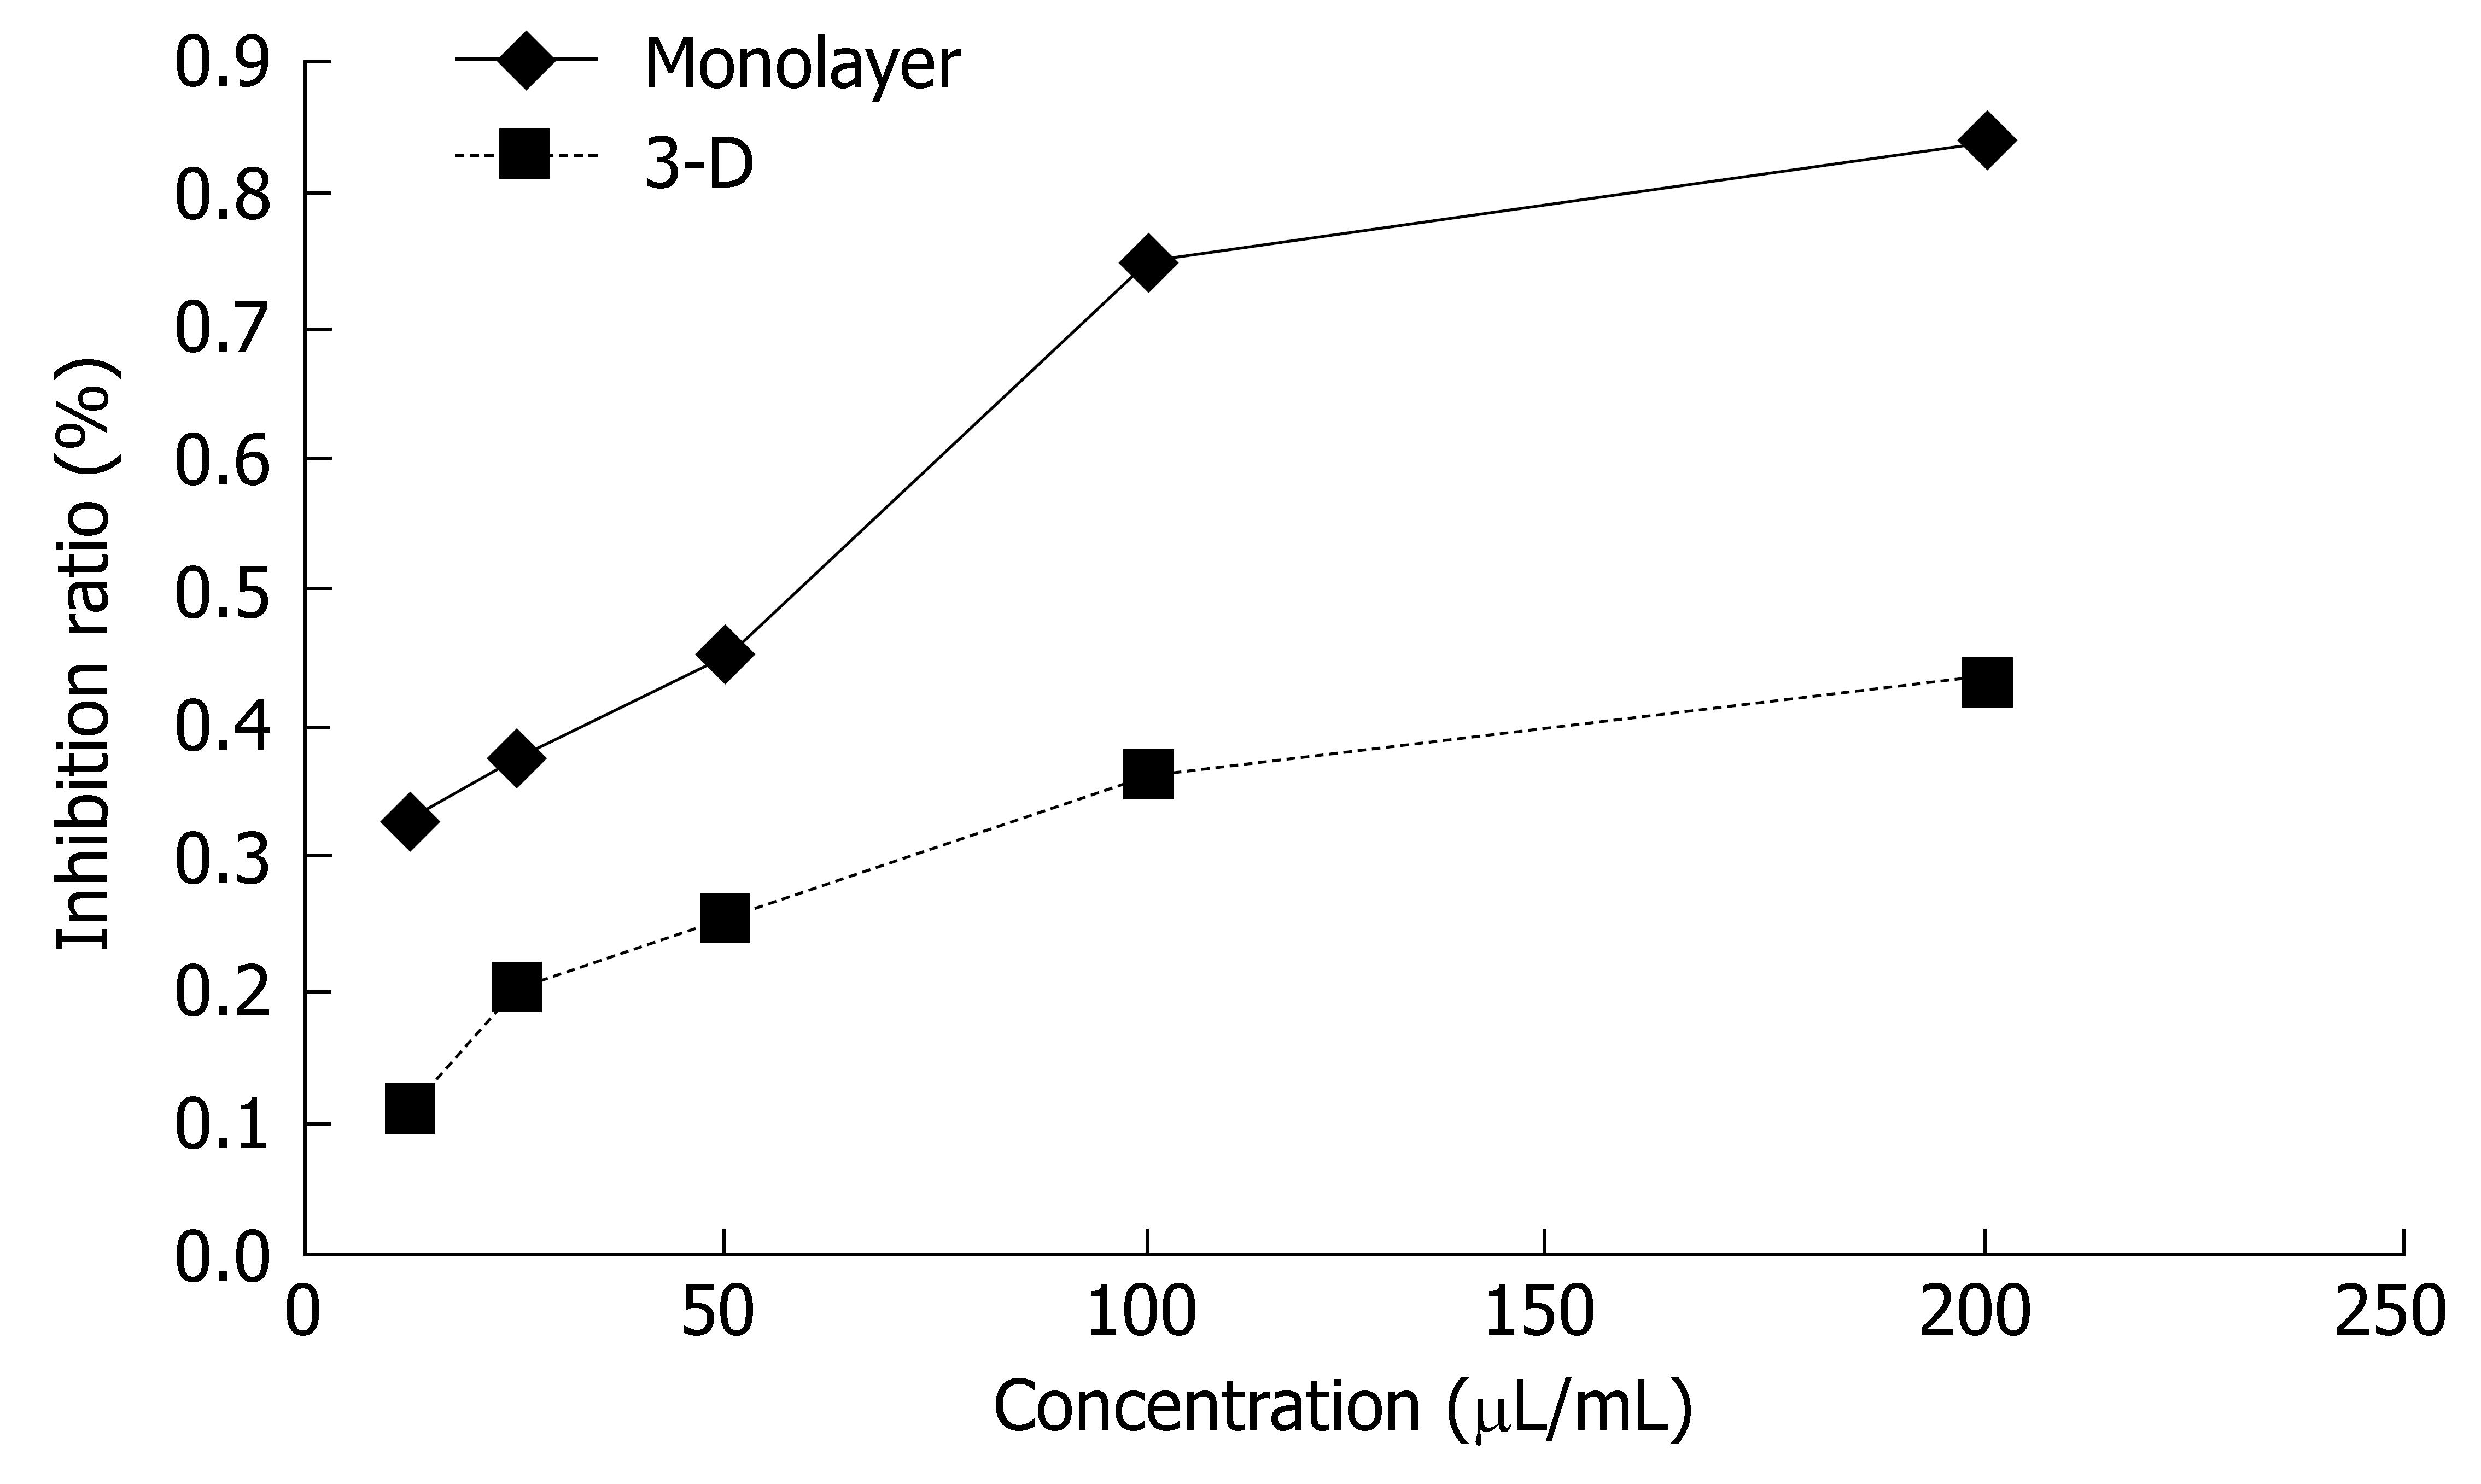
Figure 5 Sensitivity of HepG2 cells to delisheng determined by the MTT assay.
After the treatment with 12.5, 25, 50, 100 and 200 μL/mL delisheng for 48 h, the cells in three-dimensional cell culture and monolayer culture were cultured with MTT solution and cell inhibition ratio was determined. The cells in monolayer culture were more sensitive to delisheng (P < 0.01).
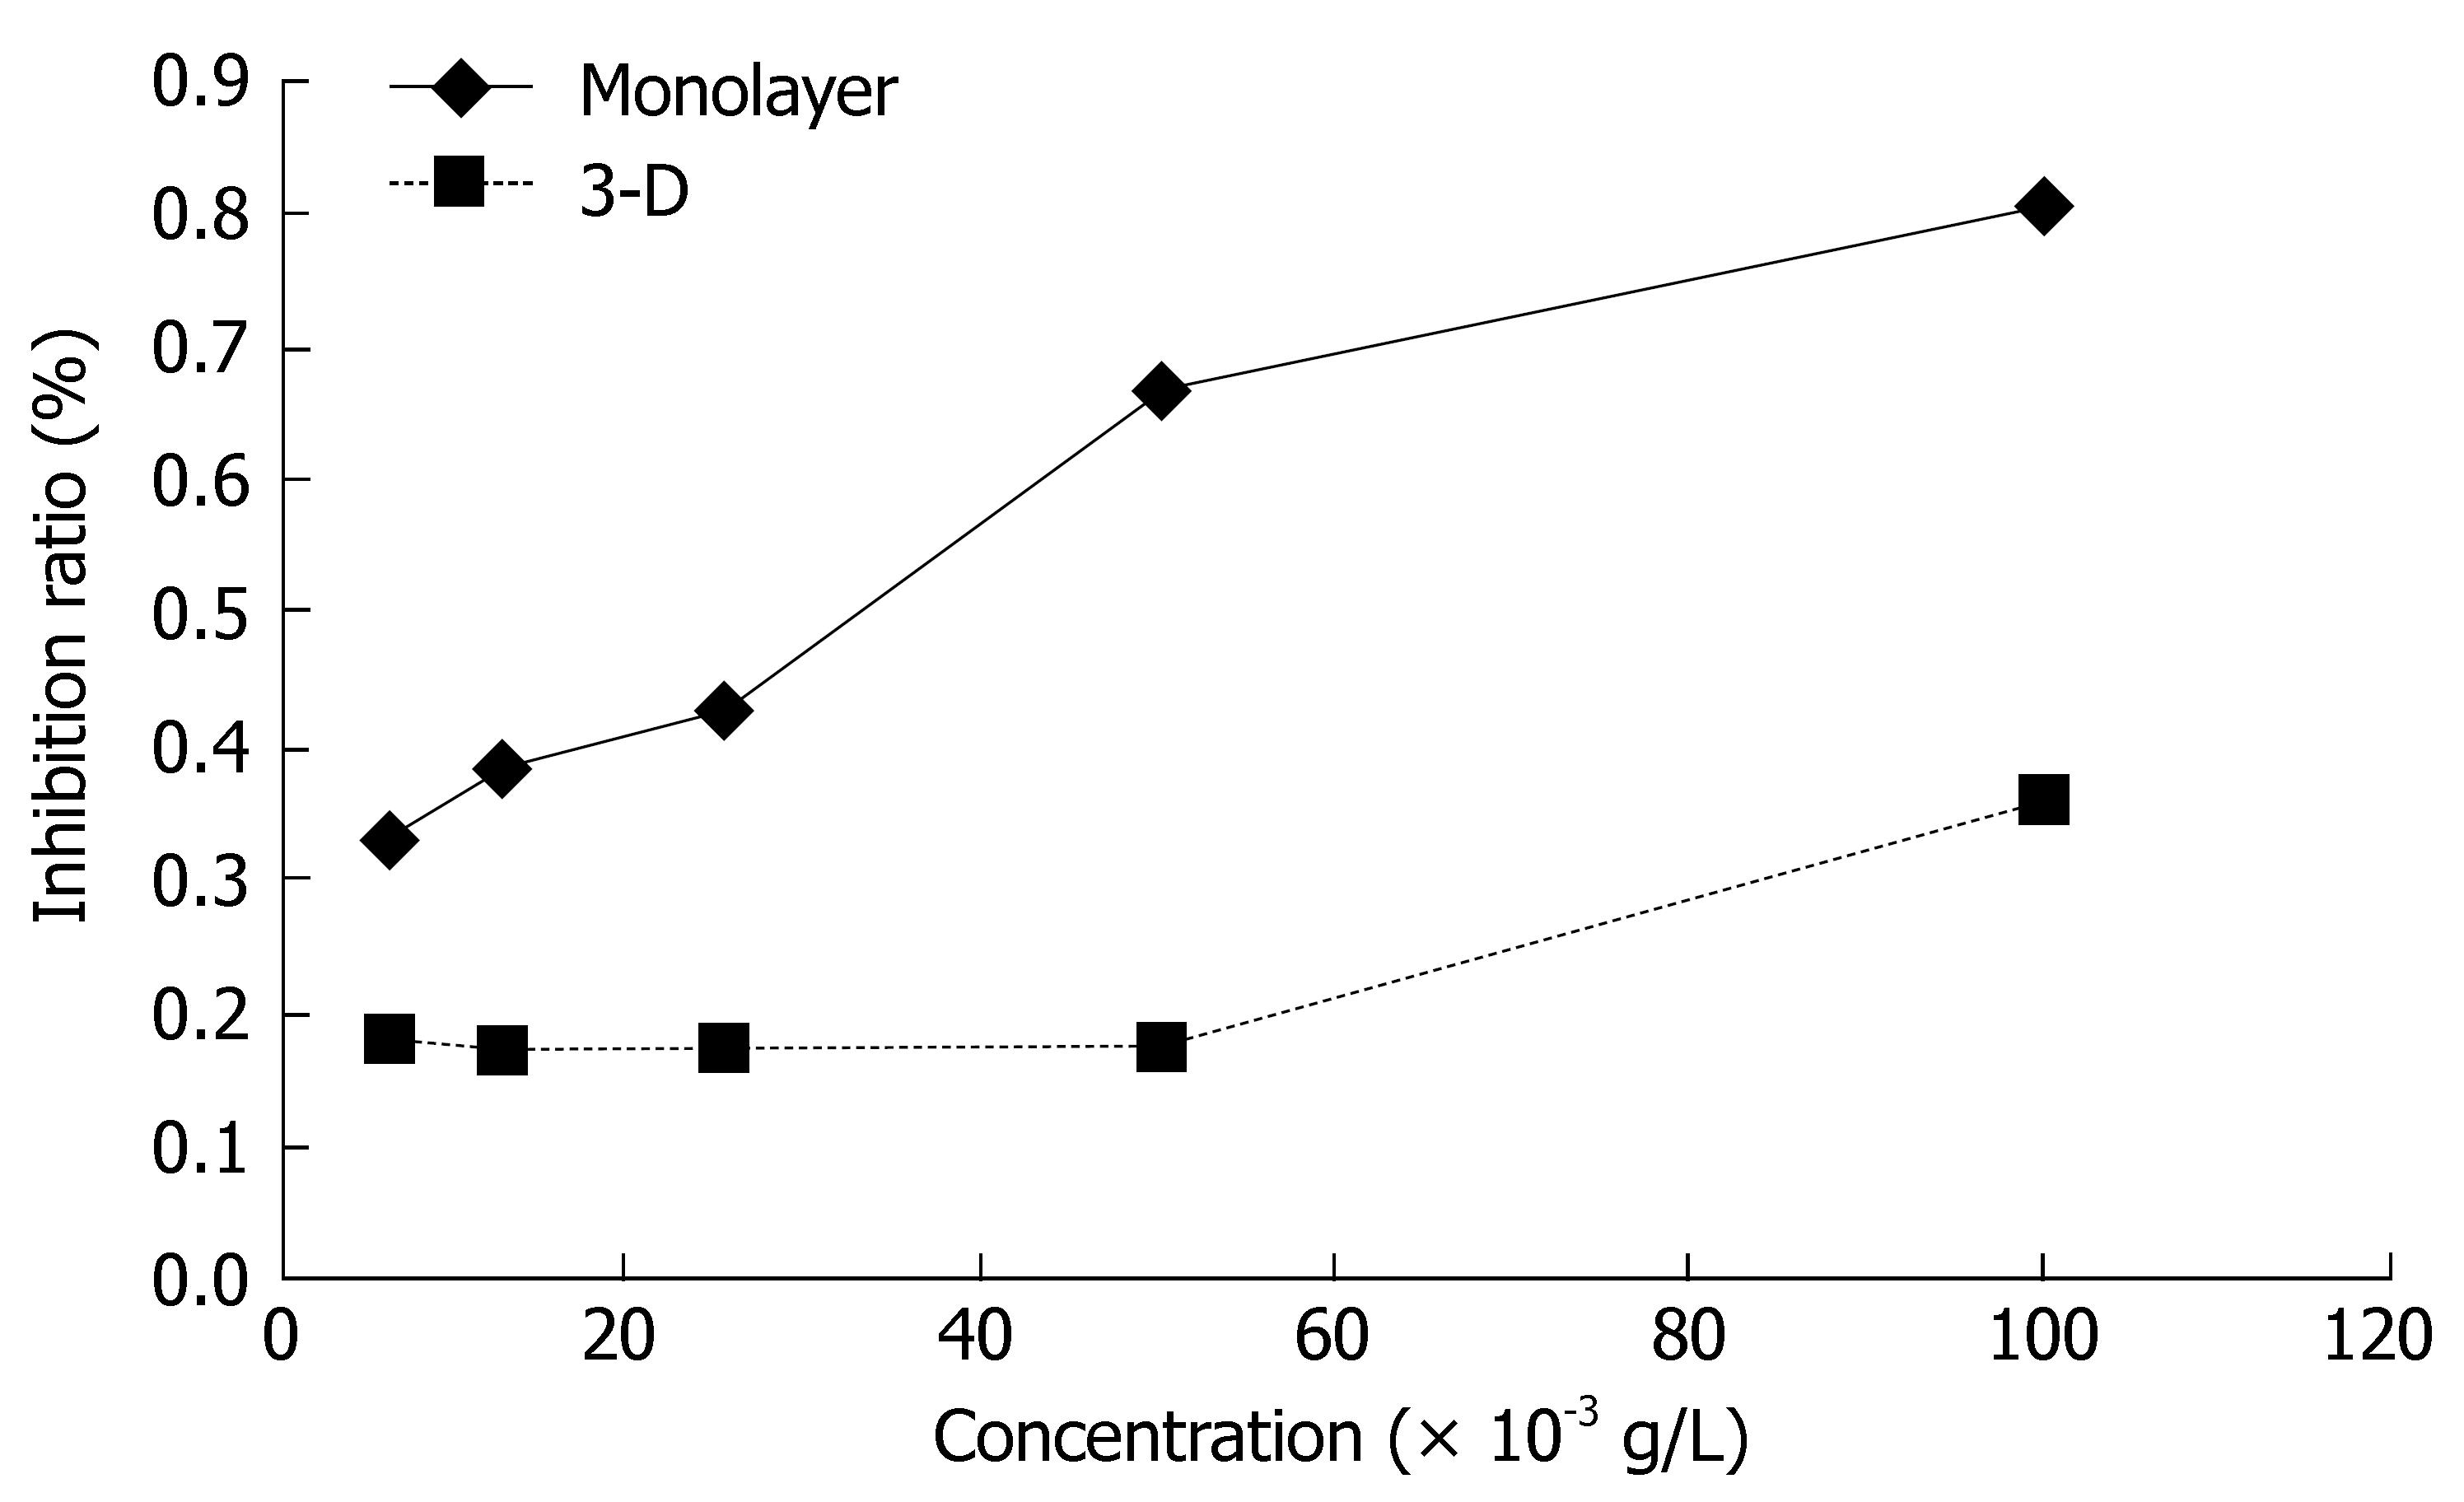
Figure 6 Sensitivity of HepG2 cells to 5-fluorouracil determined by the MTT assay.
After the treatment with 6.25, 12.5, 25, 50 and 100 × 10-3 g/L 5-fluorouracil for 48 h, the cells in three-dimensional cell culture and monolayer culture were cultured with MTT solution and cell inhibition ratio was determined. The cells in monolayer culture were more sensitive to 5-fluorouracil (P < 0.01).
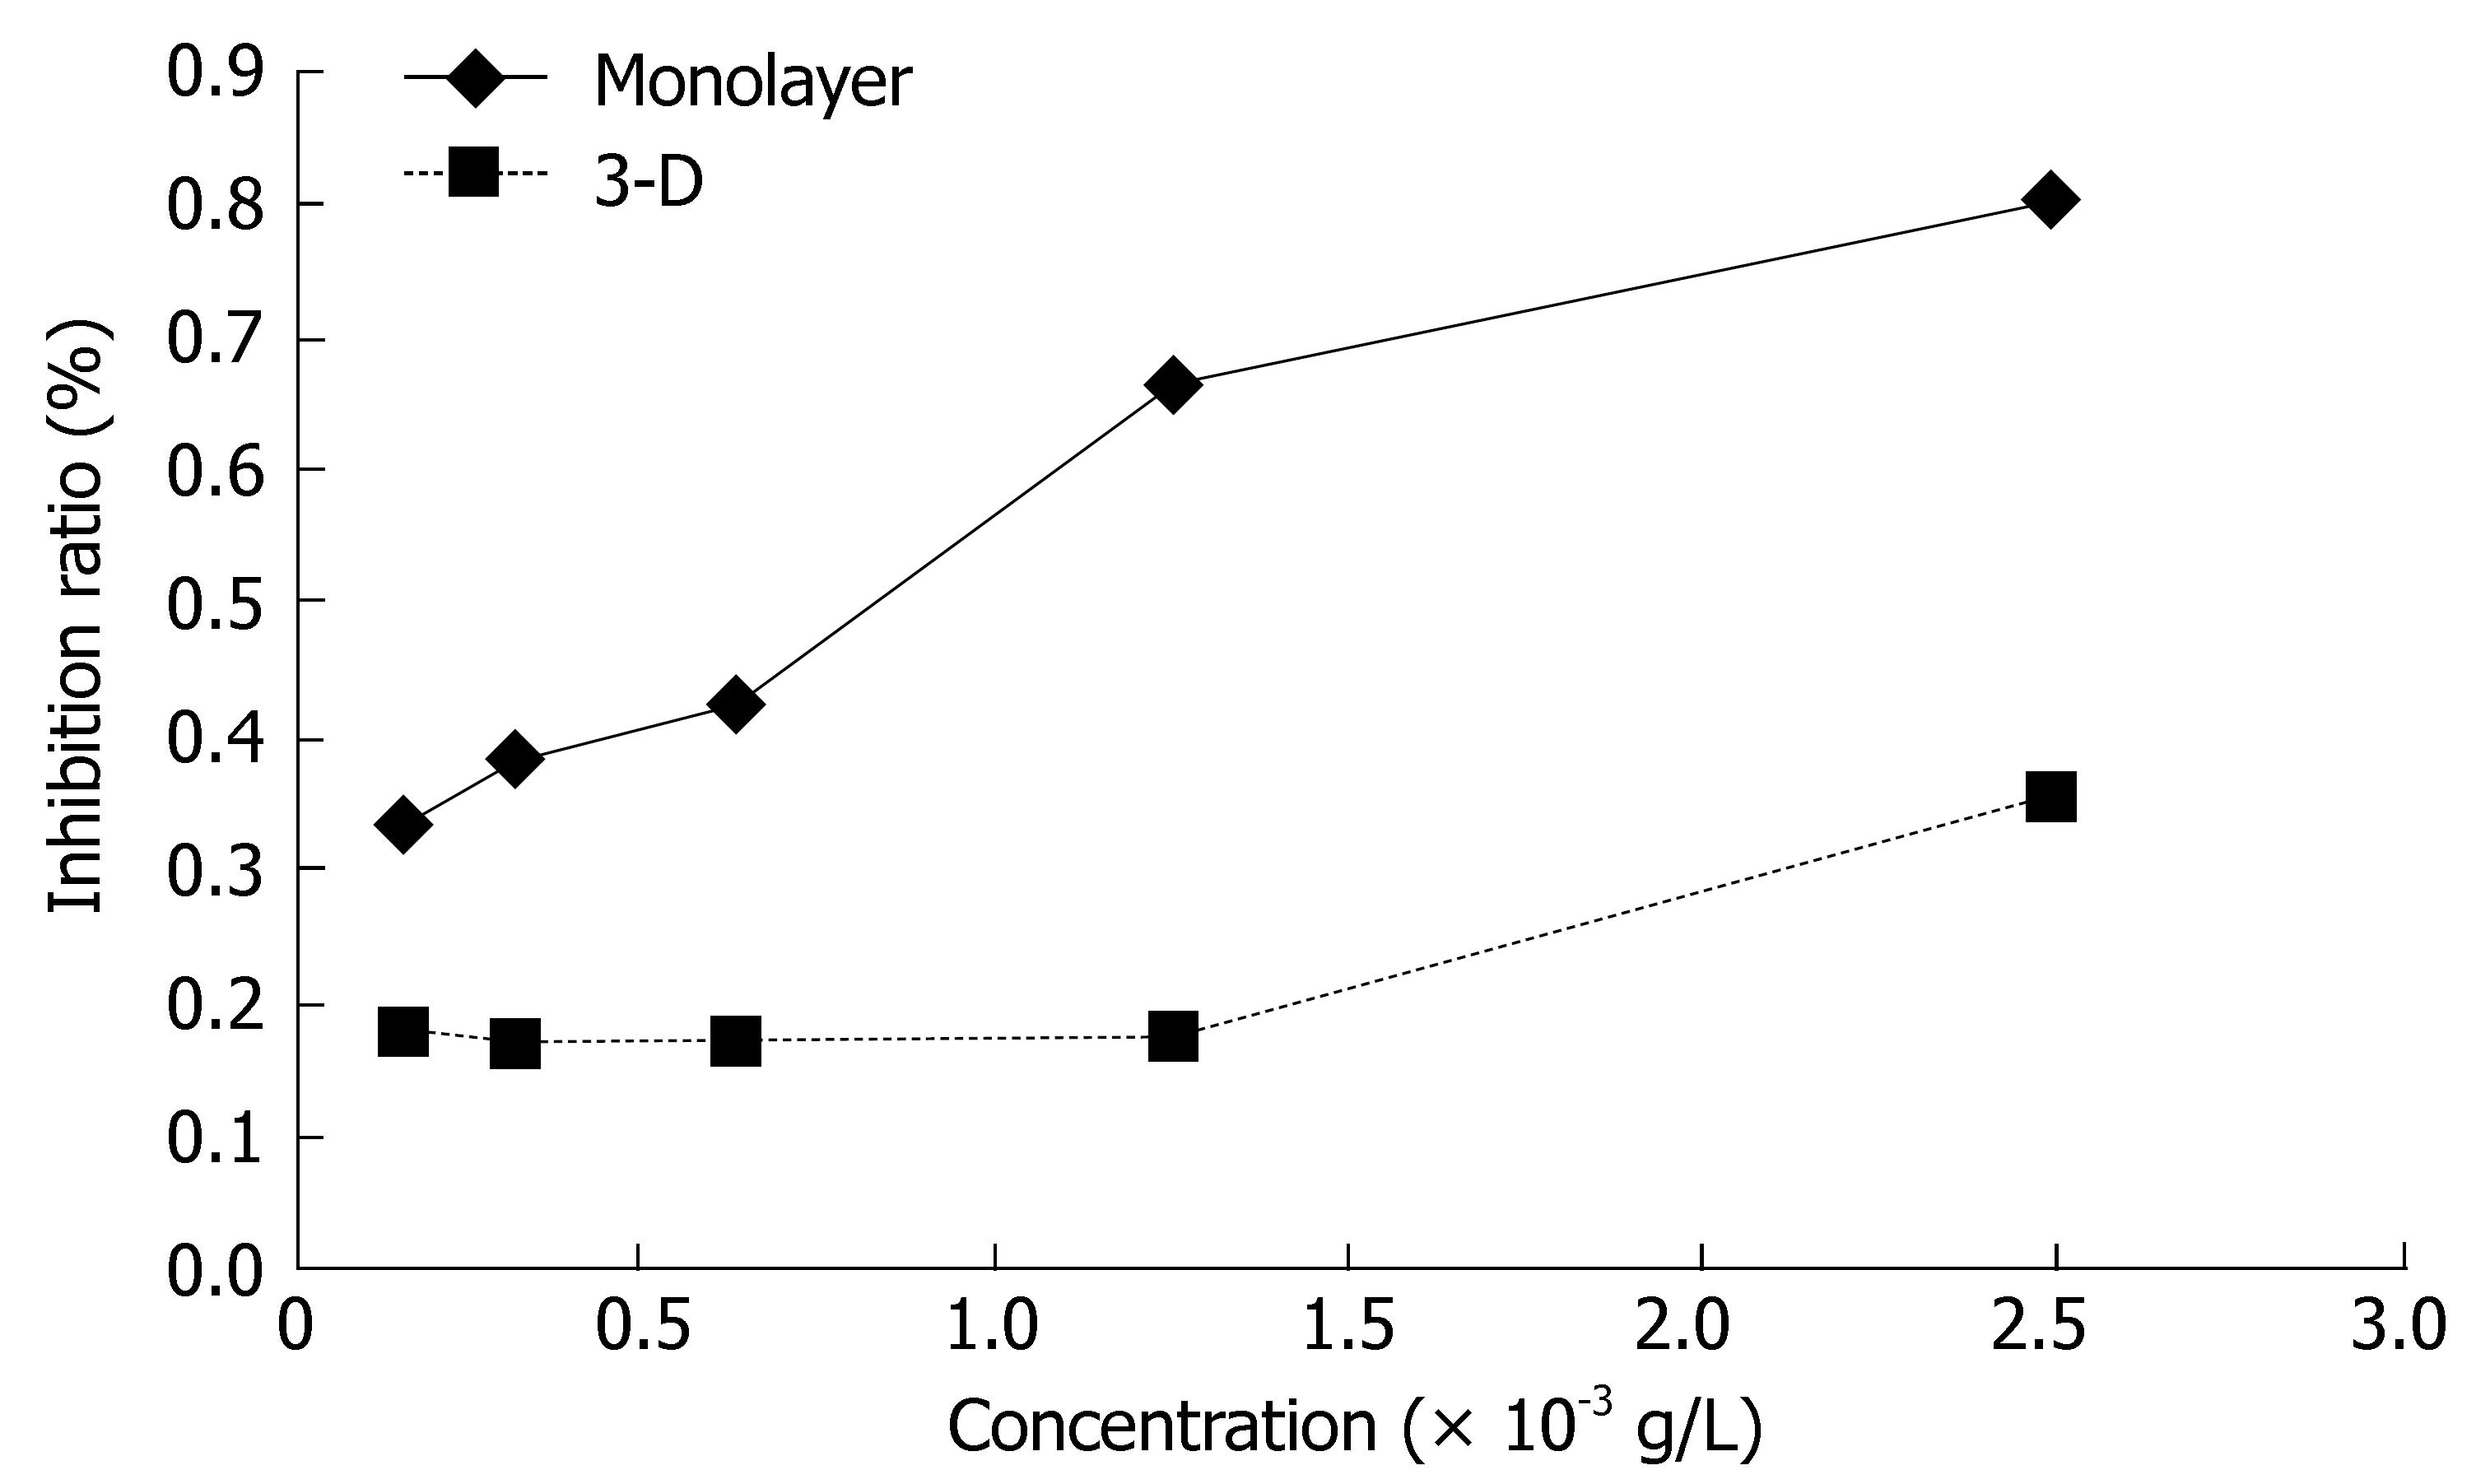
Figure 7 Sensitivity of HepG2 cells to adriamycin determined by the MTT assay.
After the treatment with 0.15625, 0.31250, 0.62500, 1.25000, 2.50000 × 10⁻³ g/L adriamycin for 48 h, the cells in-three dimensional cell culture and monolayer culture were cultured with MTT solution and cell inhibition ratio was determined. The cells in monolayer culture were more sensitive to adriamycin (P < 0.01).
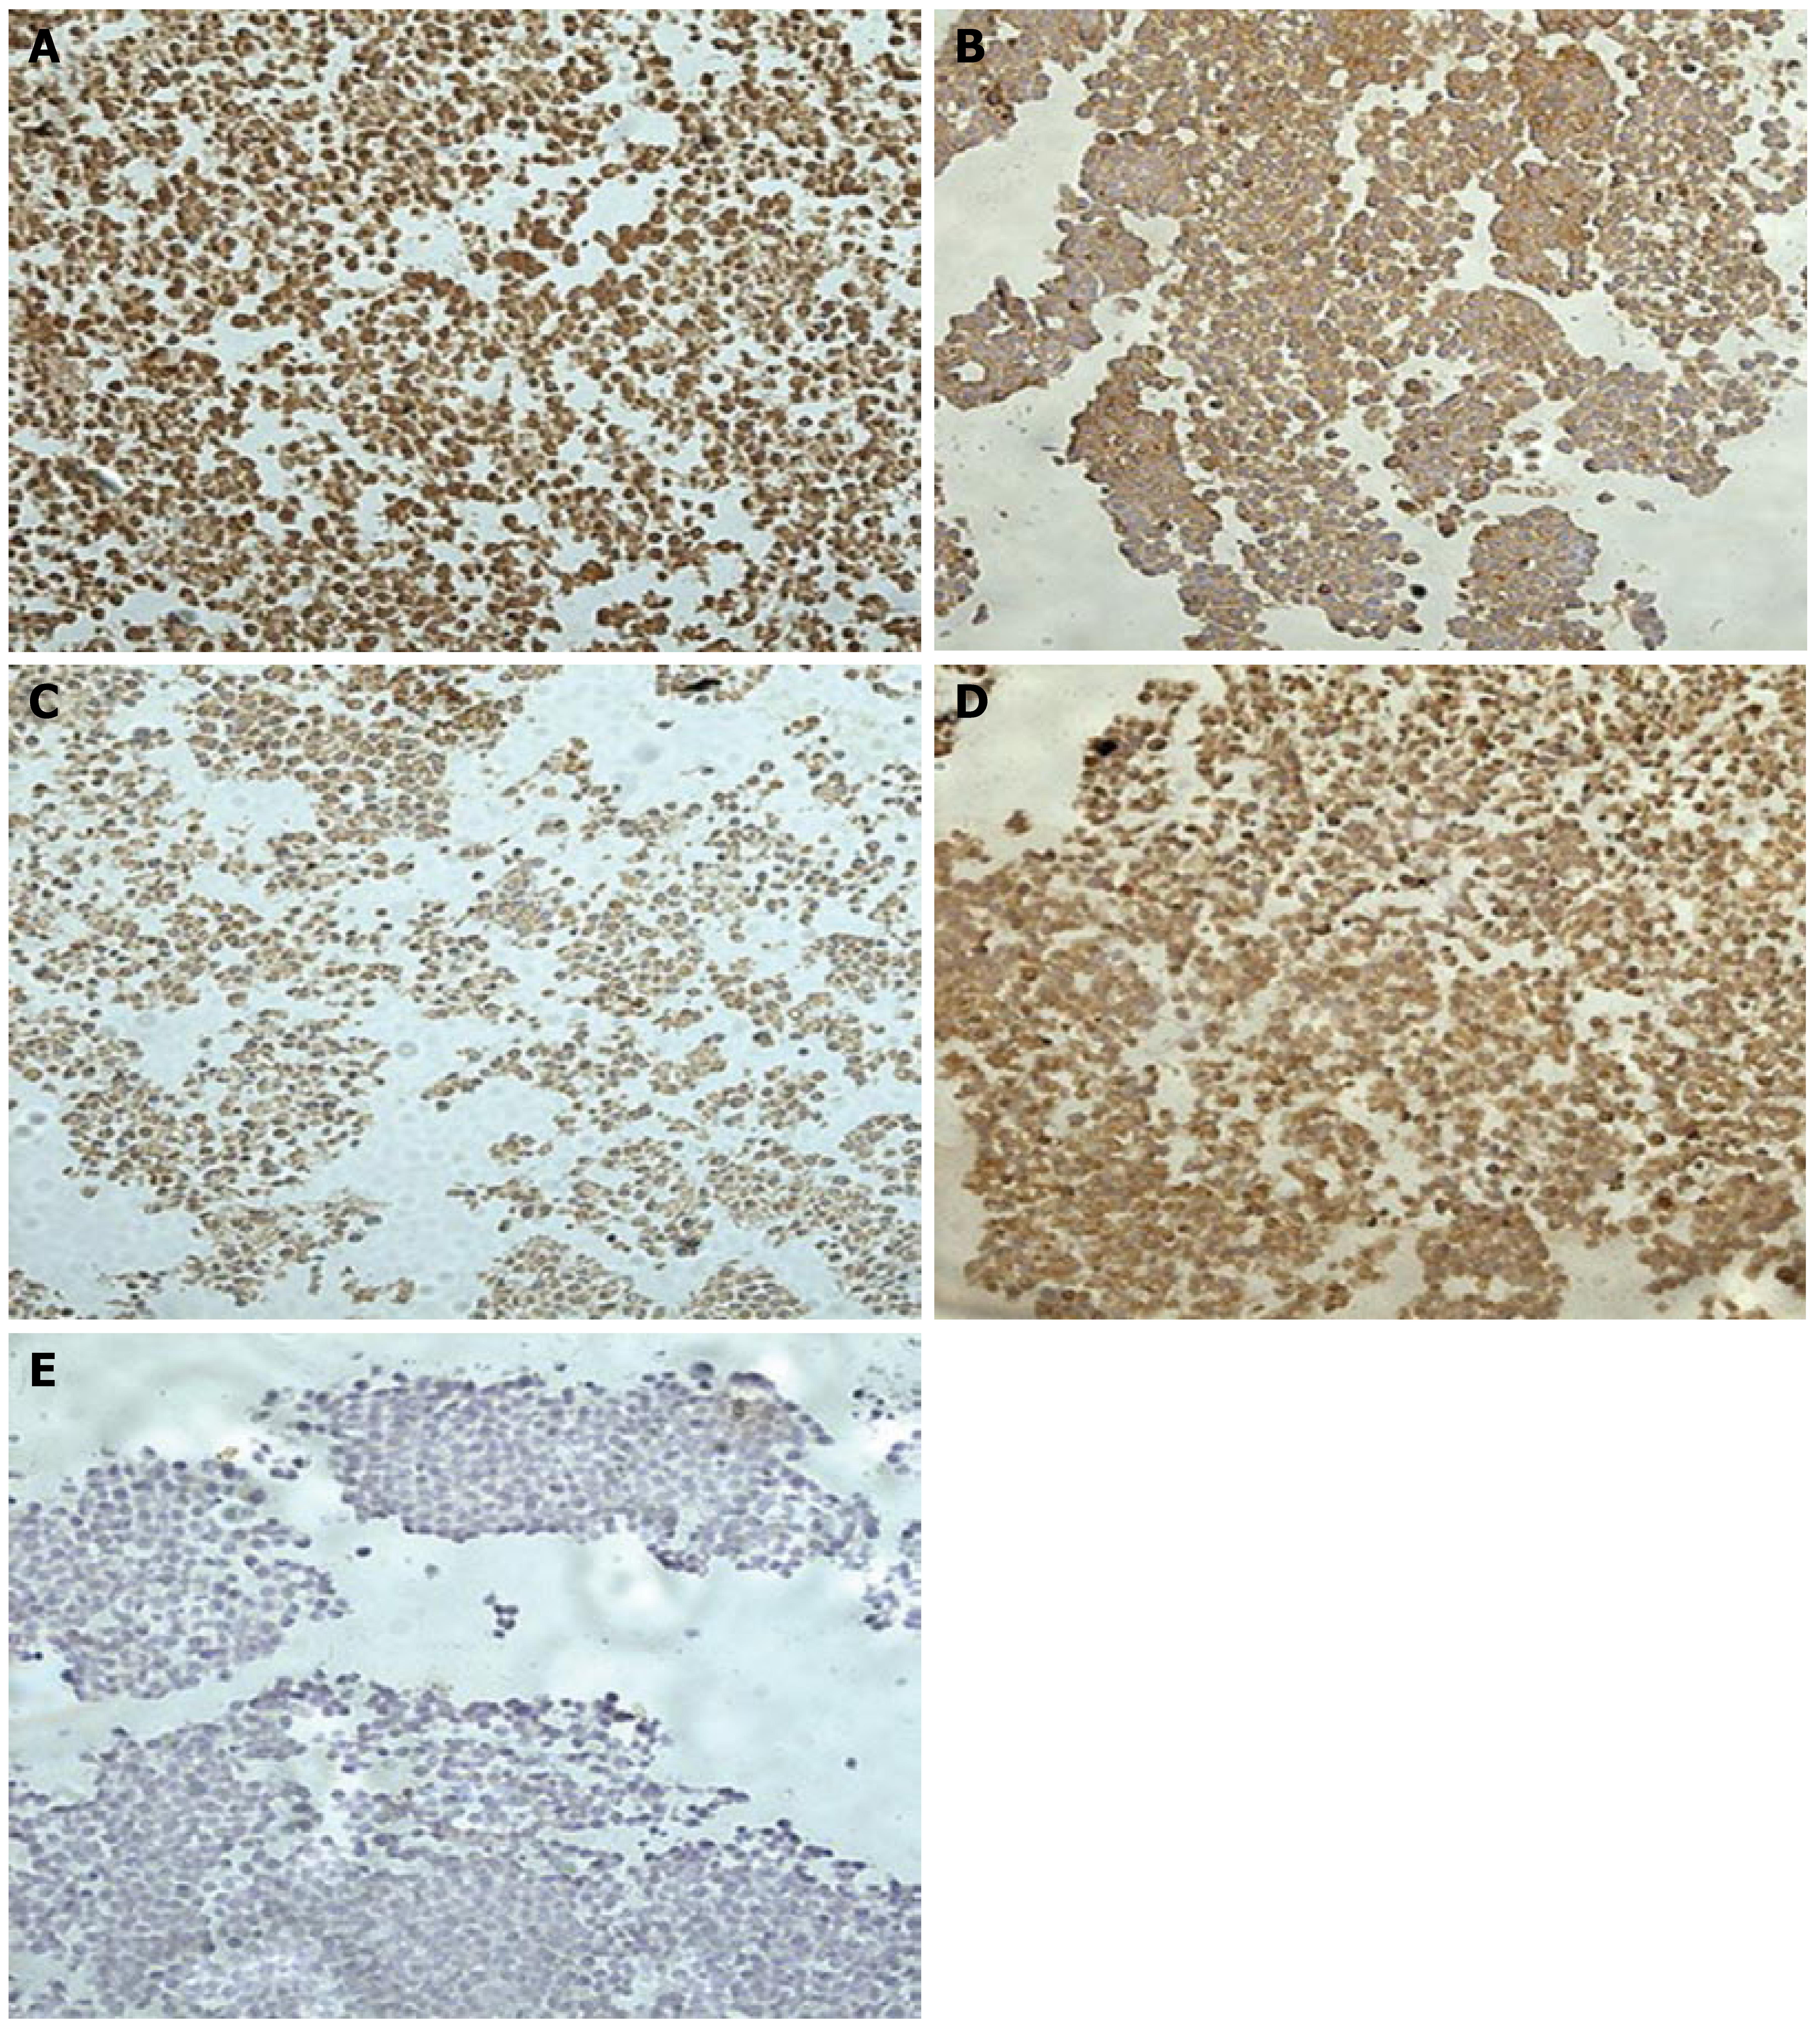
Figure 8 Immunohistochemical staining patterns of formalin-fixed and paraffin-embedded multicellular spheroids of HepG2 cells (× 200).
[A: delisheng; B: adriamycin; C: 5-fluorouracil; D: negative control PBS; E: negative control (Primary antibody was substituted by normal rabbit serum)]. Endostatin expression was confirmed in multicellular spheroids, and the expression of endostatin with treatment of delisheng was higher than that of 5-fluorouracil, adriamycin and PBS (P < 0.05).
- Citation: Cui J, Nan KJ, Tian T, Guo YH, Zhao N, Wang L. Chinese medicinal compound delisheng has satisfactory anti-tumor activity, and is associated with up-regulation of endostatin in human hepatocellular carcinoma cell line HepG2 in three-dimensional culture. World J Gastroenterol 2007; 13(41): 5432-5439
- URL: https://www.wjgnet.com/1007-9327/full/v13/i41/5432.htm
- DOI: https://dx.doi.org/10.3748/wjg.v13.i41.5432


