Copyright
©2007 Baishideng Publishing Group Co.
World J Gastroenterol. Jan 28, 2007; 13(4): 612-618
Published online Jan 28, 2007. doi: 10.3748/wjg.v13.i4.612
Published online Jan 28, 2007. doi: 10.3748/wjg.v13.i4.612
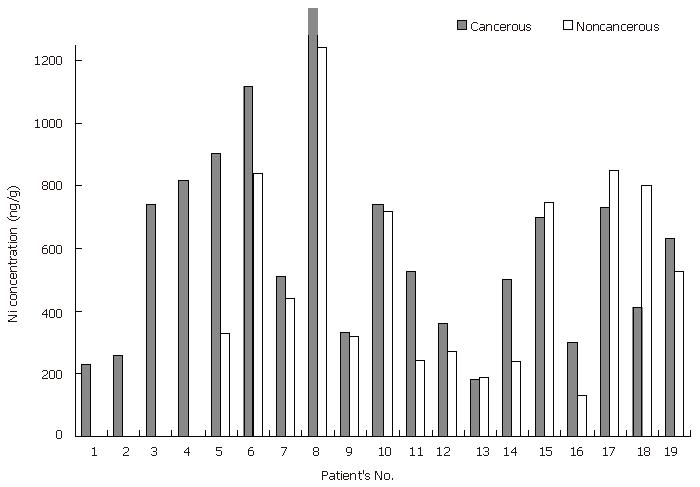
Figure 1 Comparison of Ni levels between cancerous and non-cancerous stomach tissue samples.
The concentration of number 19 is average value.
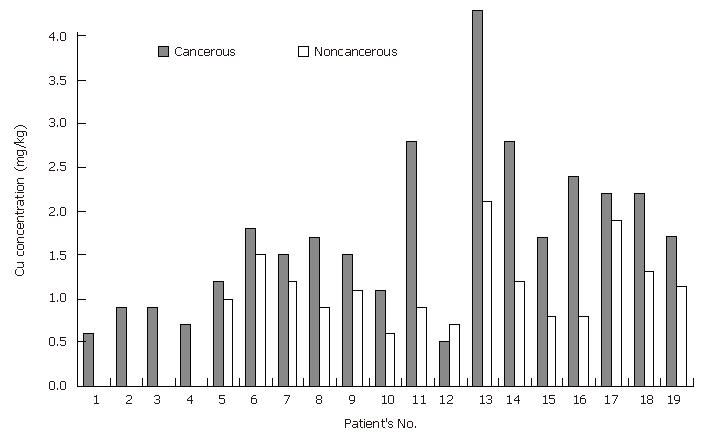
Figure 2 Comparison of Cu levels between cancerous and non-cancerous stomach tissue samples.
The concentration of number 19 is average value.
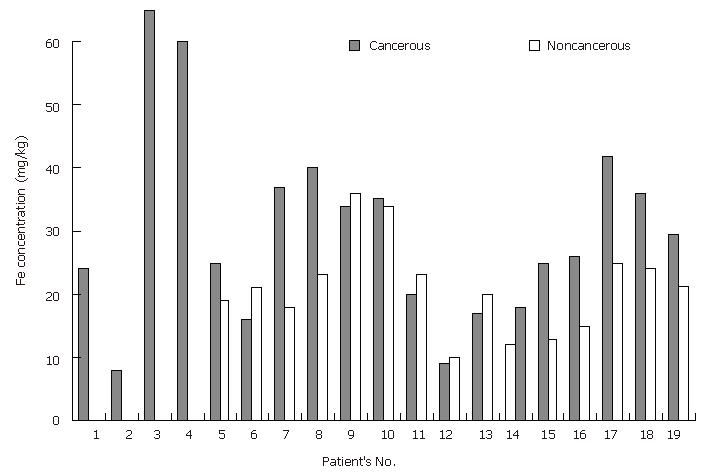
Figure 3 Comparison of Fe levels between cancerous and non-cancerous stomach tissue samples.
The concentration of number 19 is average value.
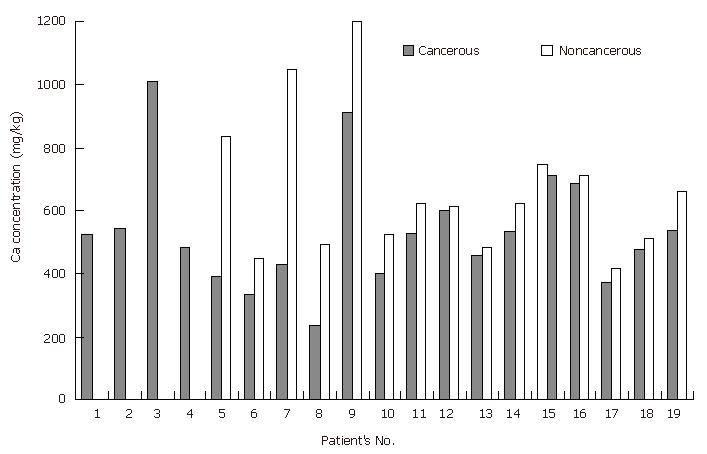
Figure 4 Comparison of Ca levels between cancerous and non-cancerous stomach tissue samples.
The concentration of number 19 is average value.
- Citation: Yaman M, Kaya G, Yekeler H. Distribution of trace metal concentrations in paired cancerous and non-cancerous human stomach tissues. World J Gastroenterol 2007; 13(4): 612-618
- URL: https://www.wjgnet.com/1007-9327/full/v13/i4/612.htm
- DOI: https://dx.doi.org/10.3748/wjg.v13.i4.612


