Copyright
©2007 Baishideng Publishing Group Co.
World J Gastroenterol. Jan 28, 2007; 13(4): 564-571
Published online Jan 28, 2007. doi: 10.3748/wjg.v13.i4.564
Published online Jan 28, 2007. doi: 10.3748/wjg.v13.i4.564
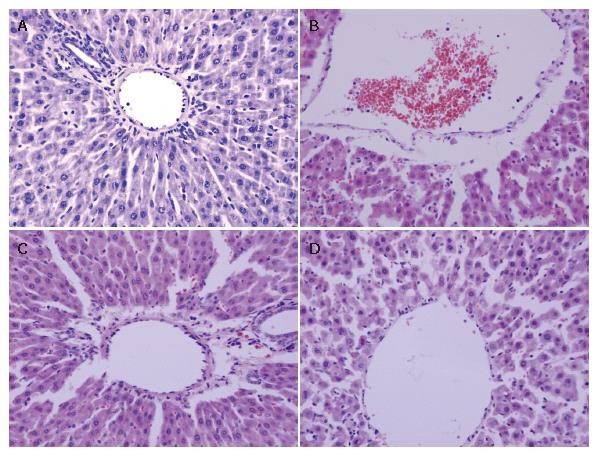
Figure 1 Changes of histology in the liver tissue 90 min after ischemia and 240 min after reperfusion in rats (× 400).
Five μm sections of liver tissue were stained with hematoxylin and eosin according to standard procedures. For all groups, n = 10. A: Control group: Normal appearance of hepatocytes and sinusoids; B: I/R group: Histological edema, hemorrhage, partial exfoliation of blood vessel endothelium and infiltration with inflammatory cells; C: I/R + VnA (10 μg/kg) group: A significant amelioration of histological edema, hemorrhage, and exfoliation of blood vessel endothelium; D: I/R + VnA (20 μg/kg) group: Slight inflammatory cell infiltration with most hepatocytes in normal appearance.
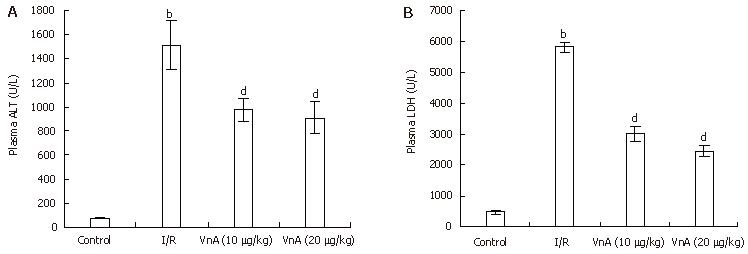
Figure 2 Plasma aminotransferase (ALT) (A) and acetic dehydrogenase (LDH) (B) levels in different groups (mean ± SD, n = 10).
After 90 min of hepatic ischemia and 4 h of reperfusion, plasma levels of ALT and LDH were determined with an OLYMPUS AU5400 automatic analyzer. bP < 0.01 vs control group; dP < 0.01 vs I/R group.
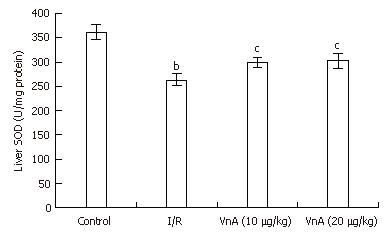
Figure 3 Activity of superoxide dismutase (SOD) in the liver tissue in different groups (mean ± SD, n = 10).
After 90 min of ischemia and 4 h of reperfusion, the liver tissue was homogenized and assayed for SOD levels with an SOD assay kit as the index of hepatic oxidative stress. bP < 0.01 vs control group; cP < 0.05 vs I/R group.
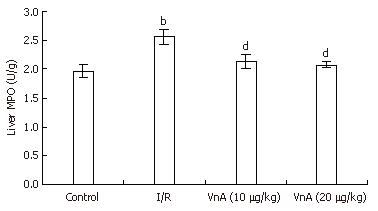
Figure 4 Activity of myeloperoxidase (MPO) in the liver tissue in different groups (mean ± SD, n = 10).
MPO contents in liver tissue were analyzed with an MPO assay kit as the index of neutrophil recruitment. bP < 0.01 vs control group; dP < 0.01 vs I/R group.
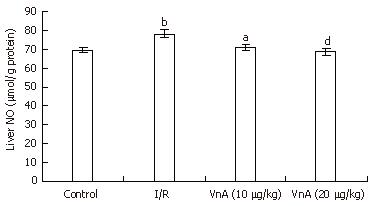
Figure 5 Content of nitric oxide (NO) in the liver tissue in different groups (mean ± SD, n = 10).
After 90 min of ischemia and 4 h of reperfusion, the liver tissue was homogenized and assayed for NO levels with an NO assay kit as the index of hepatic oxidative stress. bP < 0.01 vs control group. aP < 0.05, dP < 0.01 vs I/R group.
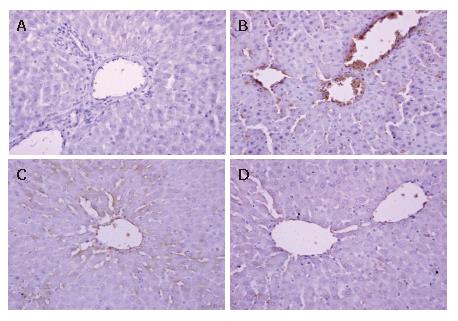
Figure 6 Immunohistochemical staining of adhesion molecule-1 (ICAM-1) expression in the liver tissue after 90 min of ischemia and reperfusion for 240 min in rats (× 400).
Formalin-fixed, paraffin-embedded liver specimens were stained by streptavidin/peroxidase immunohistochemistry technique. For all groups, n = 10. A: Control group; B: I/R group; C: I/R + VnA (10 μg/kg) group; D: I/R + VnA (20 μg/kg) group.
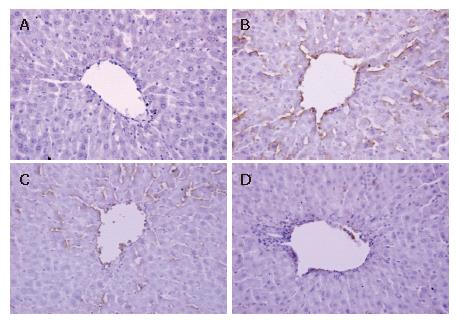
Figure 7 Immunohistochemical staining of E-selectin in liver tissue after ischemia for 90 min and reperfusion for 240 min in rats (× 400).
Formalin-fixed, paraffin-embedded liver specimens were stained by the streptavidin/peroxidase immunohistochemistry technique. For all groups, n = 10. A: Control group; B: I/R group; C: I/R + VnA (10 μg/kg) group; D: I/R + VnA (20 μg/kg) group.
Figure 8 Immunohistochemical results (semi-quantitative analysis) of adhesion molecule-1 (ICAM-1) (A) and E-selectin (B) in liver tissue in different groups.
Data were presented as mean ± SD. bP < 0.01 vs Control group; aP < 0.05, dP < 0.01 vs I/R group.
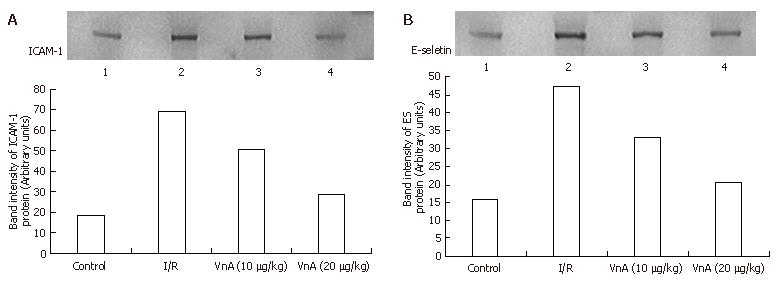
Figure 9 Liver adhesion molecule-1 (ICAM-1) (A) and E-selectin (ES) (B) protein signals of Western blot analyzed with a gel imaging system (Kodak system EDAS120, Japan).
For all groups, n = 10. L1: Control group; L2: I/R group; L3: VnA (10 μg/kg) group; L4: VnA (20 μg/kg) group. Compared with the control group, the signals in I/R group increased and weakened in the VnA pretreated group in a dose-dependent manner.
-
Citation: Wang ZZ, Zhao WJ, Zhang XS, Tian XF, Wang YZ, Zhang F, Yuan JC, Han GZ, Liu KX, Yao JH. Protection of
Veratrum nigrum L. var. ussuriense Nakai alkaloids against ischemia-reperfusion injury of the rat liver. World J Gastroenterol 2007; 13(4): 564-571 - URL: https://www.wjgnet.com/1007-9327/full/v13/i4/564.htm
- DOI: https://dx.doi.org/10.3748/wjg.v13.i4.564


