Copyright
©2007 Baishideng Publishing Group Co.
World J Gastroenterol. Jan 28, 2007; 13(4): 503-508
Published online Jan 28, 2007. doi: 10.3748/wjg.v13.i4.503
Published online Jan 28, 2007. doi: 10.3748/wjg.v13.i4.503
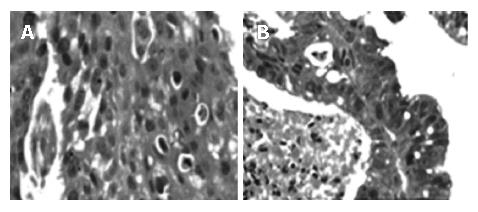
Figure 1 Representative HE stained sections at × 400 magnification selected for FISH analysis.
A: Neoplastic streaks with eosin stained keratin pearls indicating a well-differentiated squamous cell carcinoma; B: Adenocarcinomatous tissue showing columnar epithelial replacement of the normal squamous lining.
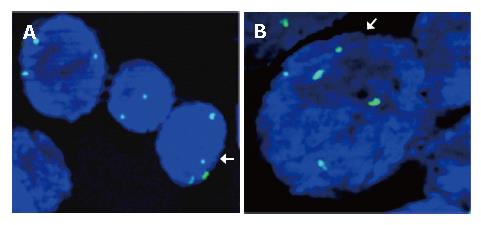
Figure 2 Images showing aneusomy with regard to chromosome 11 in esophageal cancer cells.
A: Trisomy and tetrasomy chromosome 11 in the same area; B: Pentasomy chromosome 11 with normal disomy.
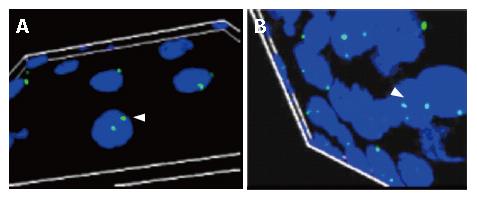
Figure 3 Axiovision Apotome software generated 3D-image from overlay of 10 consecutive images captured by the Optical sectioning microscopy.
A: A portion of the esophageal tissue section from the control showing normal disomy of chromosome 11 (indicated by an arrow); B: Tissues from patients with well-differentiated squamous cell carcinoma (arrow indicating cell with trisomy for chromosome 11).
-
Citation: Mohan V, Ponnala S, Reddy HM, Sistla R, Jesudasan RA, Ahuja YR, Hasan Q. Chromosome 11 aneusomy in esophageal cancers and precancerous lesions- an early event in neoplastic transformation: An interphase fluorescence
in situ hybridization study from south India. World J Gastroenterol 2007; 13(4): 503-508 - URL: https://www.wjgnet.com/1007-9327/full/v13/i4/503.htm
- DOI: https://dx.doi.org/10.3748/wjg.v13.i4.503


