Copyright
©2007 Baishideng Publishing Group Inc.
World J Gastroenterol. Oct 21, 2007; 13(39): 5245-5252
Published online Oct 21, 2007. doi: 10.3748/wjg.v13.i39.5245
Published online Oct 21, 2007. doi: 10.3748/wjg.v13.i39.5245
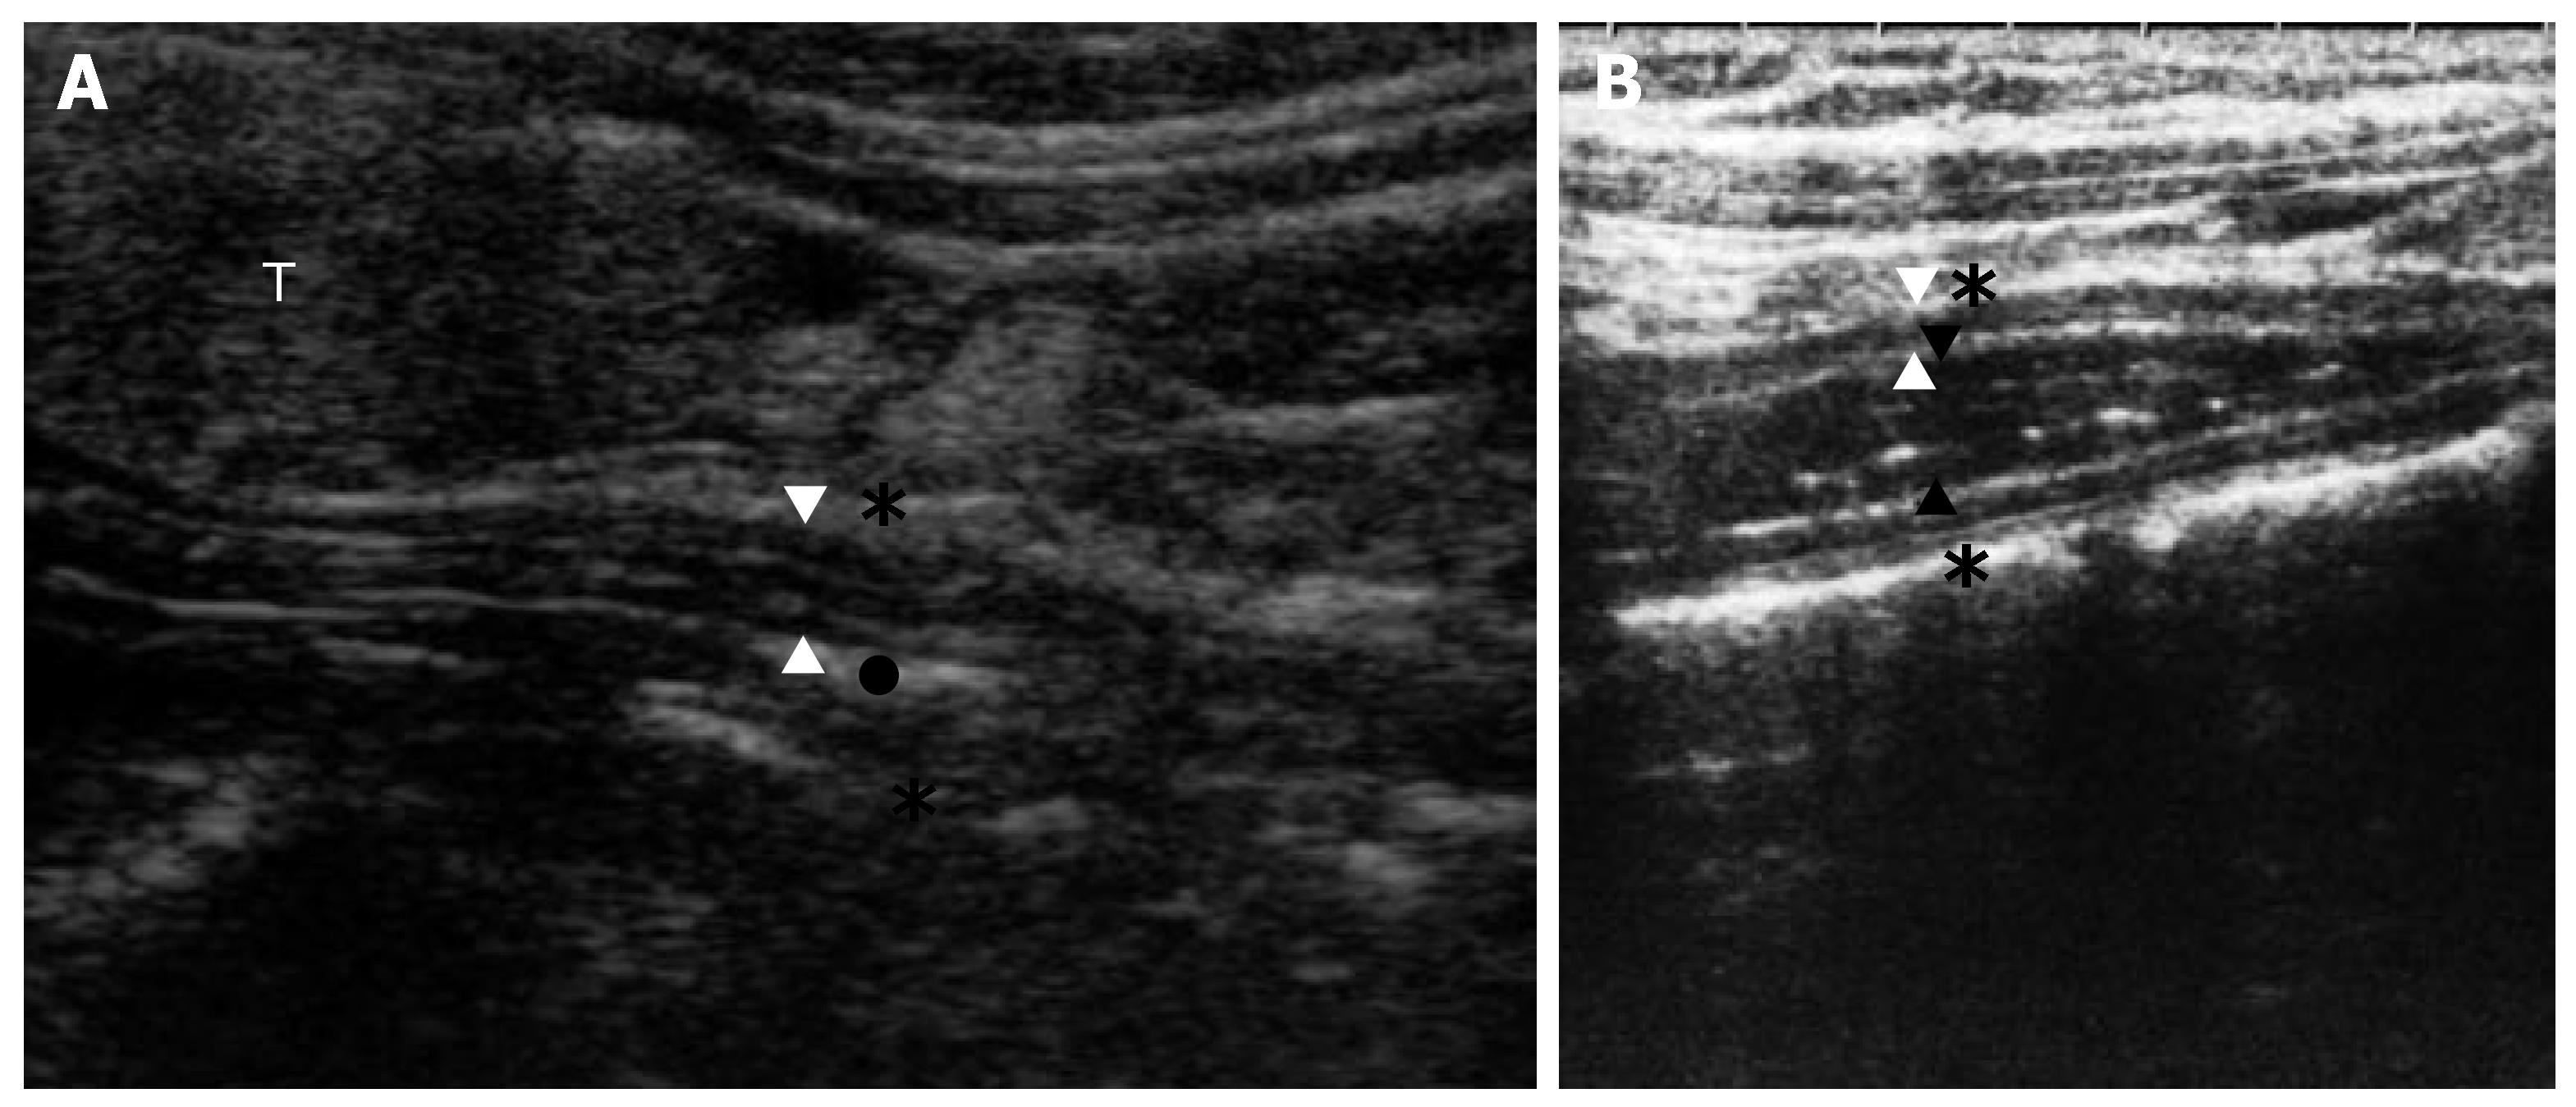
Figure 1 The TCEUS appearance with and without refluxate.
A: A pattern showing no anechoic fluid in the lumen. Note anterior esophageal wall (distance between the open arrowheads), esophageal lumen without fluid inside and hyperechogenic bands representing collapsed lumen and mucosa (dark dot). T: thyroid; B: A pattern showing anechoic fluid in the lumen. Note esophageal wall (distance between the open arrowheads), refluxate in the esophageal lumen (distance between the dark arrowheads) and esophageal diameter (distance between the asterisks).
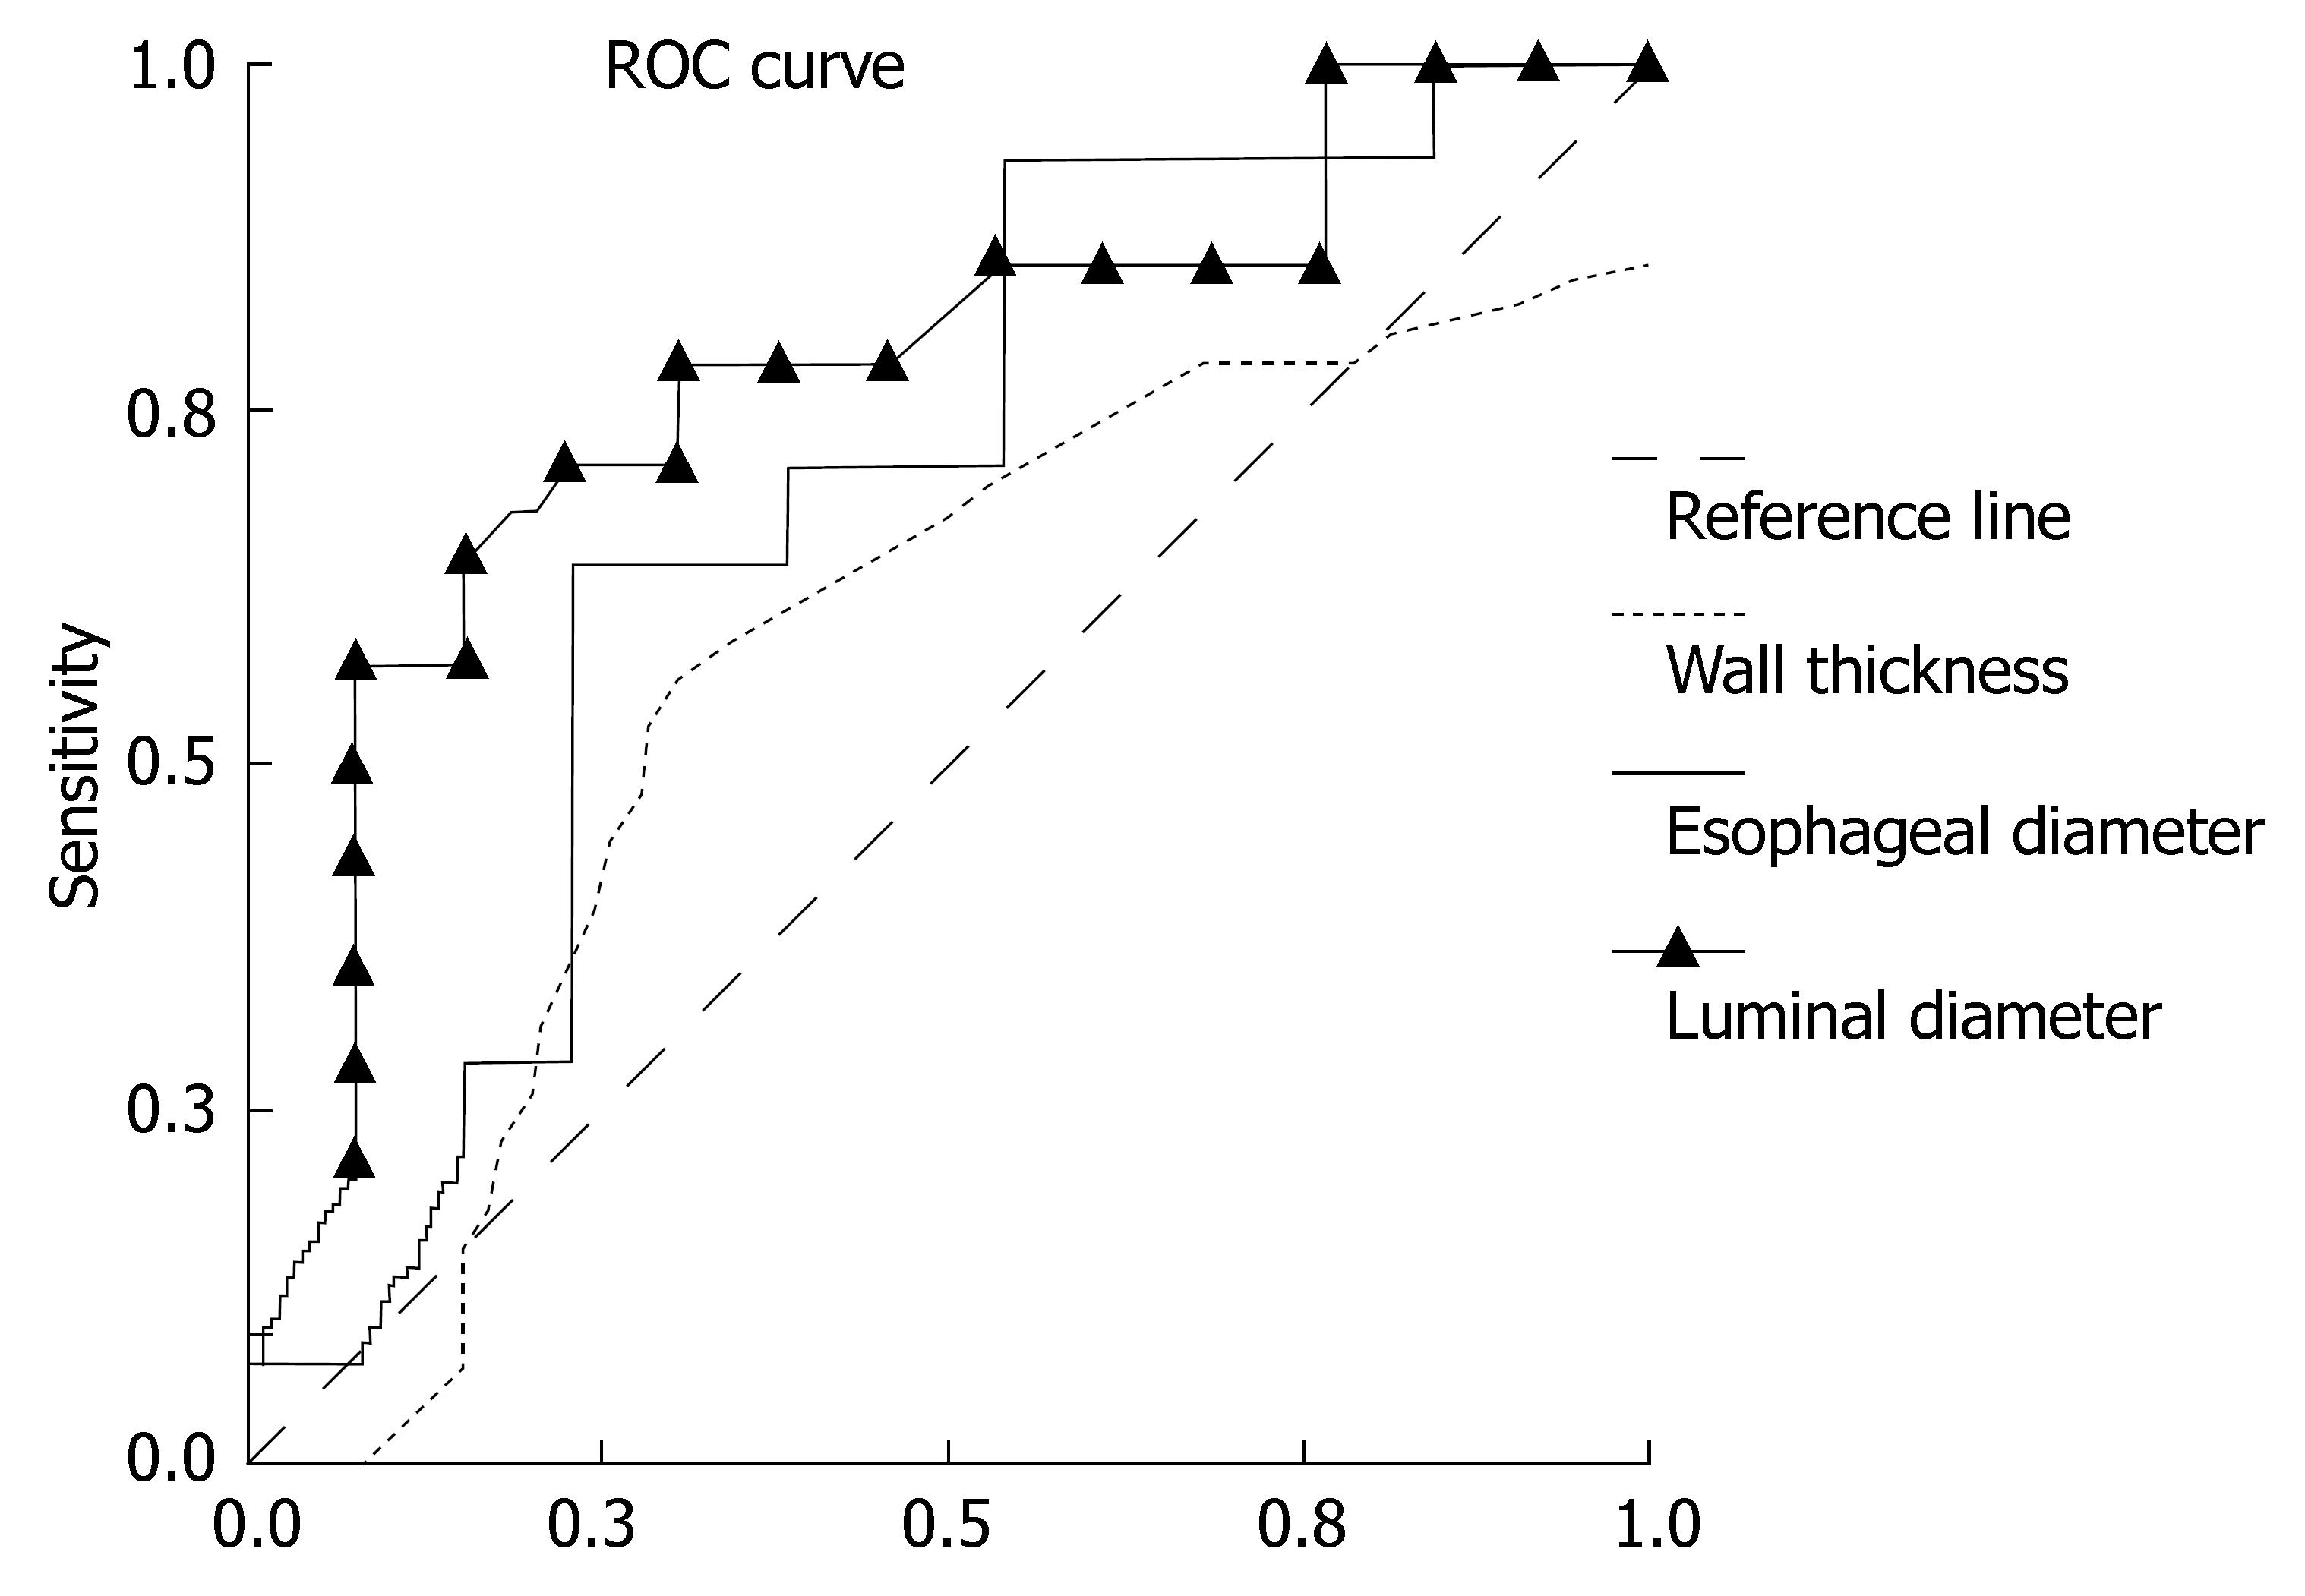
Figure 2 The ROC curve showing the relation between TCEUS findings according to total PR group (B + D) (n = 14) and reflux-negative group (E) (n = 13) (AUC = 0.
775, P = 0.015 for ELD). PR: Isolated proximal reflux; ELD: Esophageal luminal diameter.
- Citation: Kacar S, Uysal S, Kuran S, Dagli U, Ozin Y, Karabulut E, Sasmaz N. Transcutaneous cervical esophagus ultrasound in adults: Relation with ambulatory 24-h pH-monitoring and esophageal manometry. World J Gastroenterol 2007; 13(39): 5245-5252
- URL: https://www.wjgnet.com/1007-9327/full/v13/i39/5245.htm
- DOI: https://dx.doi.org/10.3748/wjg.v13.i39.5245


