Copyright
©2007 Baishideng Publishing Group Co.
World J Gastroenterol. Oct 14, 2007; 13(38): 5079-5089
Published online Oct 14, 2007. doi: 10.3748/wjg.v13.i38.5079
Published online Oct 14, 2007. doi: 10.3748/wjg.v13.i38.5079
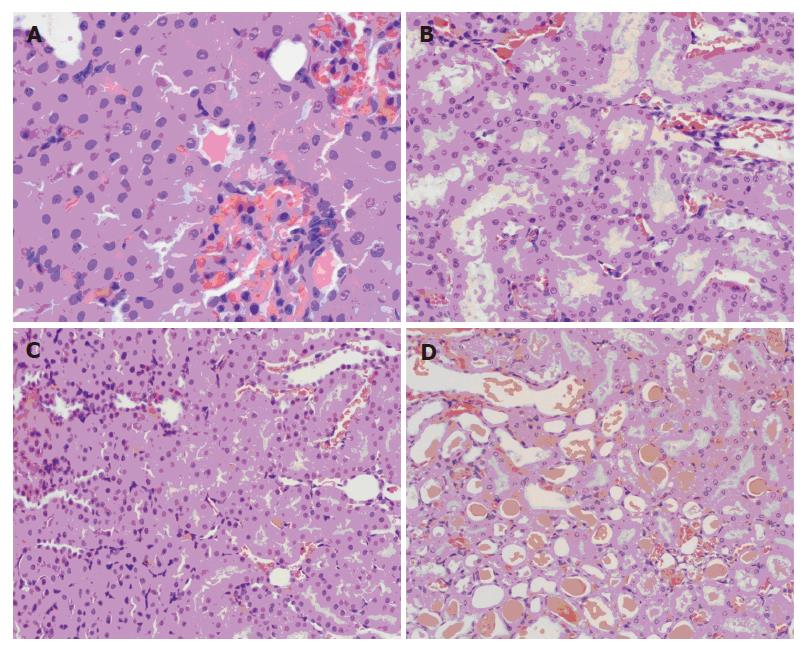
Figure 1 Light microscopic changes of kidney (HE, ×400).
A: 3-h model group showing protein cast in renal tubule; B and C: 6-h model group showing scattered degenerative necrosis in renal tubular epithelial cells, and renal interstitial edema, respectively; D: 12-h model group showing visible red cell cast.
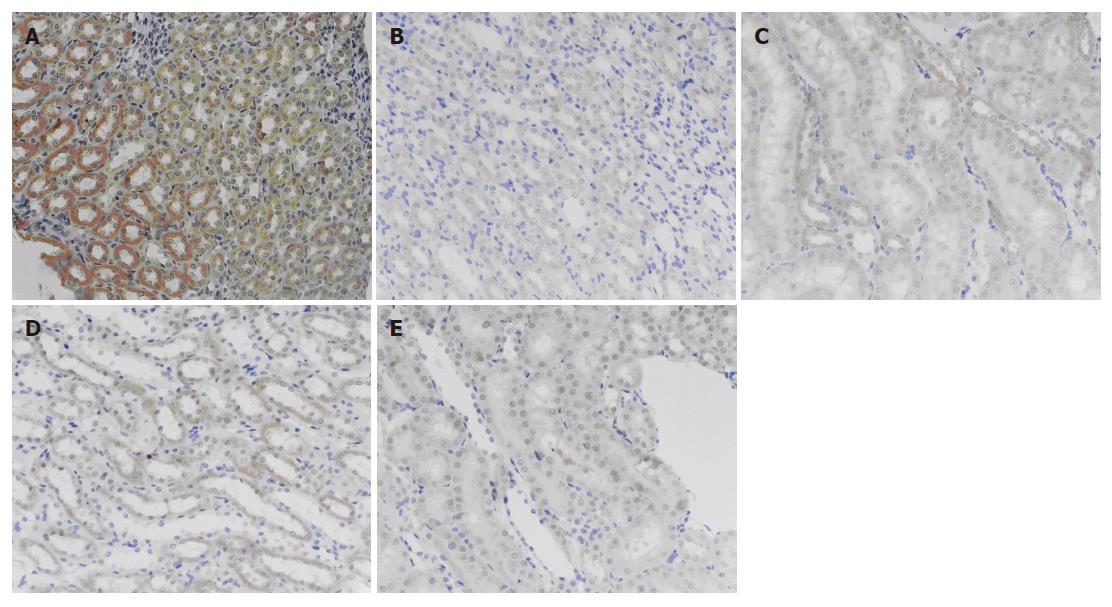
Figure 2 Bax expression in different groups (×200).
A: 12-h model group showing high (+++) Bax expression; B: 3-h Baicalin-treated with negative (-) Bax expression; C: 12-h model group showing moderate (++) Bax expression; D and E: 6-h octreotide-treated group showing mild (+) Bax expression.
Figure 3 Bcl-2 expression in different groups (× 200).
A and B: 6-h model group showing high (+++) Bcl-2 expression; C: 6-h octreotide-treated group with negative (-) Bcl-2 expression.
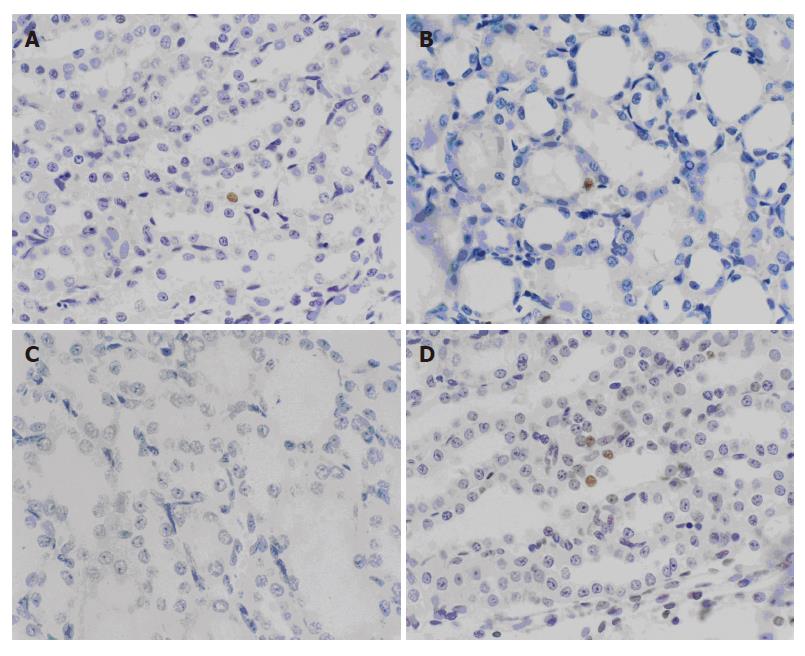
Figure 4 Apoptosis in different groups (TUNEL, × 400).
A: 6-h octreotide-treated group showing apoptosis of renal tubular epithelial cells; B: 6-h Baicalin-treated group showing apoptosis of renal tubular epithelial cells; C: 6-h model group with no (-) apoptosis; D: 6-h octreotide-treated group showing apoptosis of renal tubular epithelial cells.
- Citation: Zhang XP, Tian H, Lai YH, Chen L, Zhang L, Cheng QH, Yan W, Li Y, Li QY, He Q, Wang F. Protective effects and mechanisms of Baicalin and octreotide on renal injury of rats with severe acute pancreatitis. World J Gastroenterol 2007; 13(38): 5079-5089
- URL: https://www.wjgnet.com/1007-9327/full/v13/i38/5079.htm
- DOI: https://dx.doi.org/10.3748/wjg.v13.i38.5079


