Copyright
©2007 Baishideng Publishing Group Co.
World J Gastroenterol. Sep 21, 2007; 13(35): 4761-4770
Published online Sep 21, 2007. doi: 10.3748/wjg.v13.i35.4761
Published online Sep 21, 2007. doi: 10.3748/wjg.v13.i35.4761
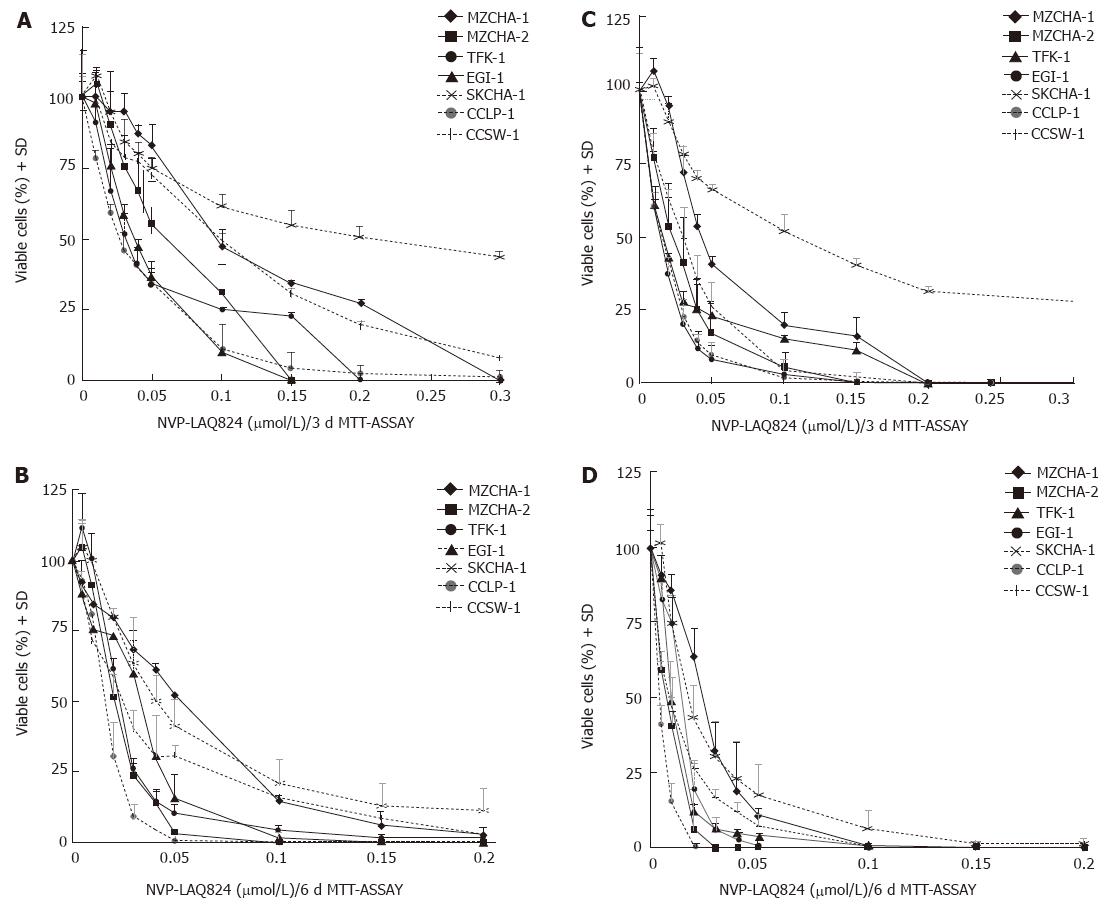
Figure 1 In vitro treatment of biliary tract cancer cell lines with NVP-LAQ824 and NVP-LBH589.
A: 3-d incubation with NVP-LAQ824 (n = 3); B: 6-d incubation with NVP-LAQ824 (n = 3); C: 3-d incubation with NVP-LBH589 (n = 3); D: 6-d incubation with NVP-LBH589 (n = 3).
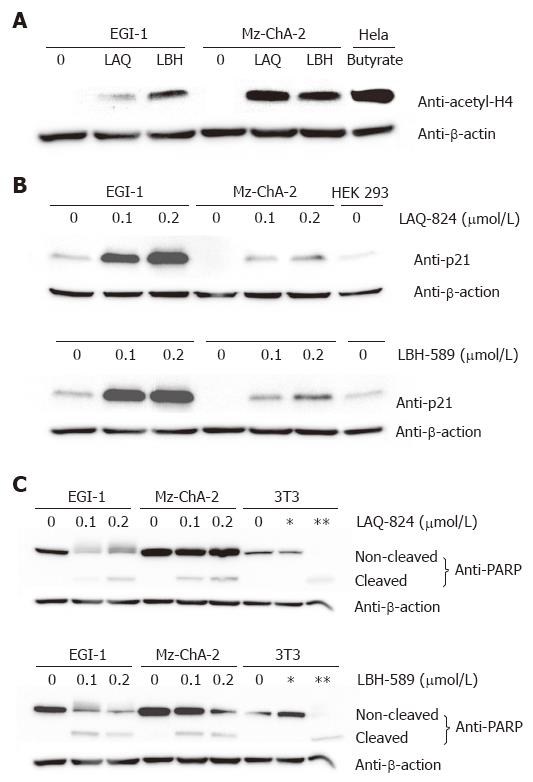
Figure 2 Mechanism of drug action after in vitro treatment with NVP-LAQ824 and NVP-LBH589 for 24 h.
Lane *: NIH-3T3 cells treated with 25 μmol/L etoposide for 5 h (negative control); lane **: NIH-3T3 cells treated with 10 μmol/L etoposide for 24 h (positive control). A: acetylation of histone H4; B: p21WAF-1/CIP-1 expression; C: PARP cleavage.
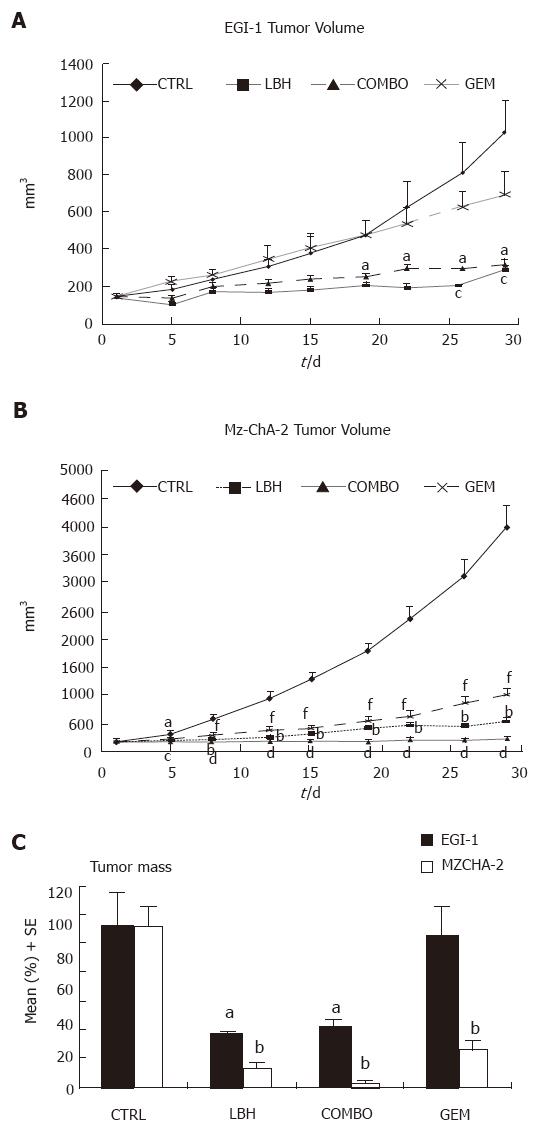
Figure 3 In vivo treatment with NVP-LBH589 ± gemcitabine in chimeric mice.
A: Effect on tumor volume of EGI-1 cells (aP < 0.05, NVP-LBH589 vs control; cP < 0.05, COMBO vs control); B: Effect on tumor volume of Mz-ChA-2 cells (aP < 0.05, bP < 0.01, NVP-LBH589 vs control; cP < 0.05, dP < 0.01, COMBO vs control; fP < 0.01, gemcitabine vs control); C: Effect on tumor mass (aP < 0.05, NVP-LBH589 or COMBO vs control; bP < 0.01, NVP-LBH589 or COMBO or gemcitabine vs control).
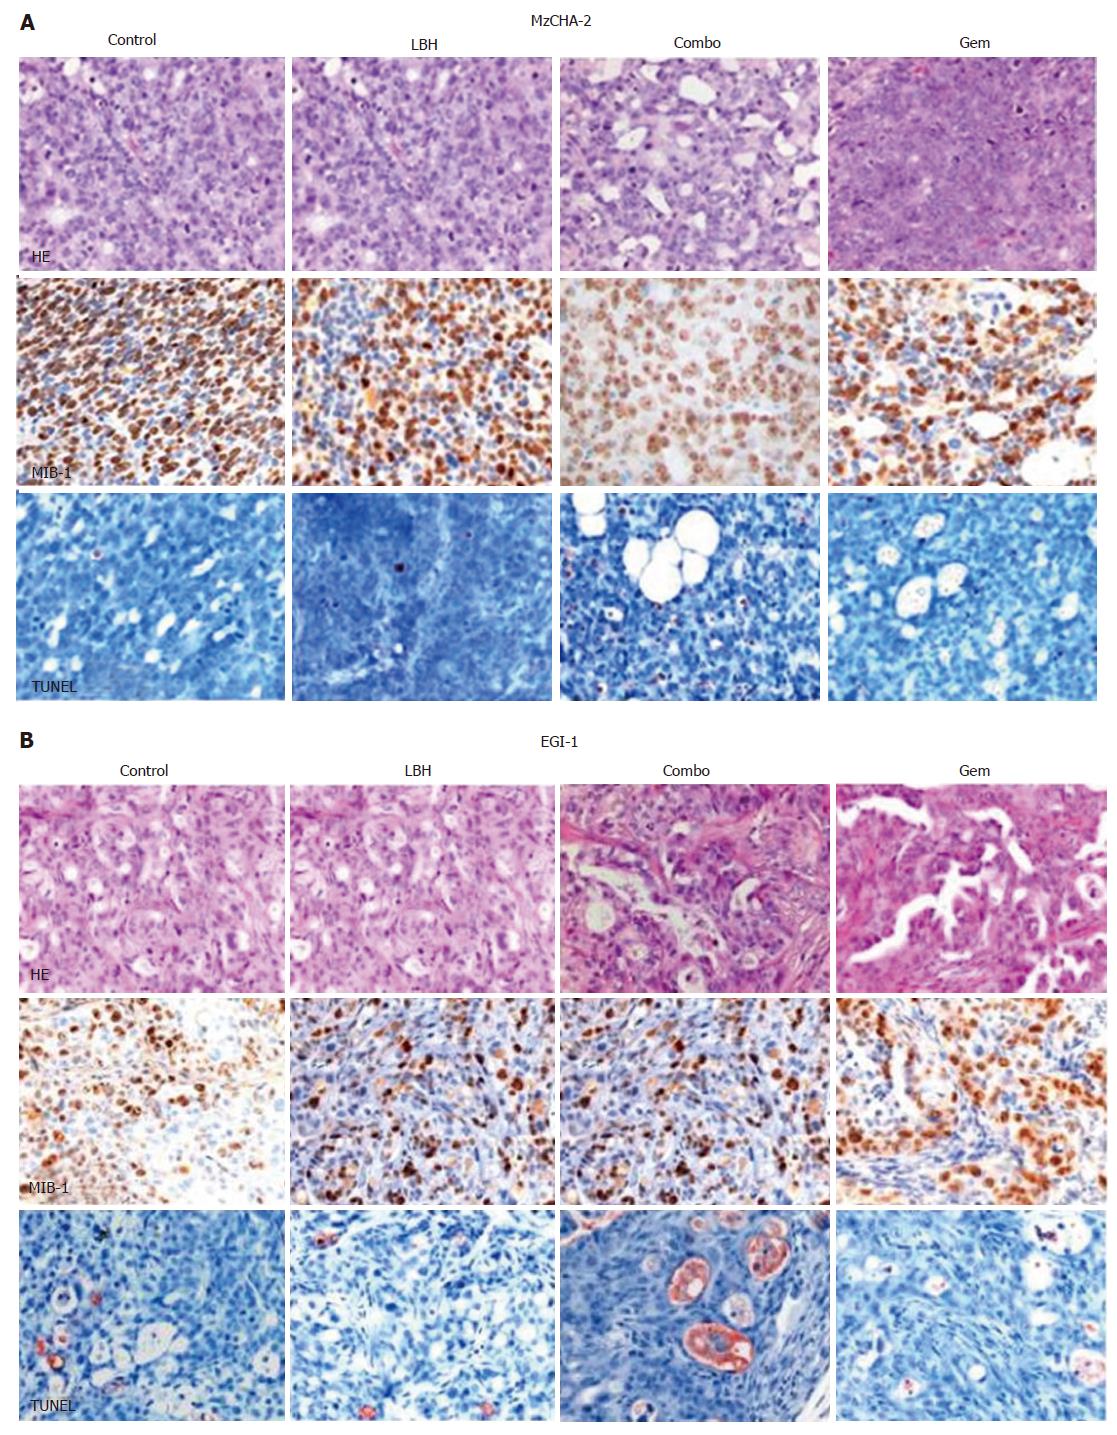
Figure 4 Hematoxilin-eosin (HE), MIB-1 (proliferation marker) and TUNEL (apoptosis marker) staining of mouse tumors (SABC, × 40).
A: cell line Mz-ChA-2; B: cell line EGI-1.
- Citation: Bluethner T, Niederhagen M, Caca K, Serr F, Witzigmann H, Moebius C, Mossner J, Wiedmann M. Inhibition of histone deacetylase for the treatment of biliary tract cancer: A new effective pharmacological approach. World J Gastroenterol 2007; 13(35): 4761-4770
- URL: https://www.wjgnet.com/1007-9327/full/v13/i35/4761.htm
- DOI: https://dx.doi.org/10.3748/wjg.v13.i35.4761


