Copyright
©2007 Baishideng Publishing Group Co.
World J Gastroenterol. Sep 7, 2007; 13(33): 4529-4532
Published online Sep 7, 2007. doi: 10.3748/wjg.v13.i33.4529
Published online Sep 7, 2007. doi: 10.3748/wjg.v13.i33.4529
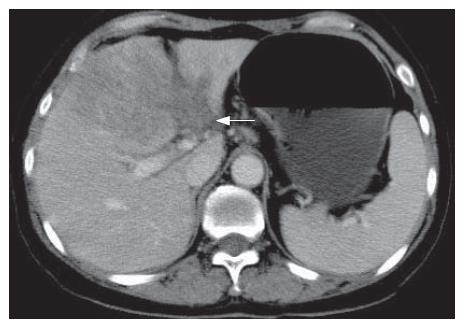
Figure 1 Portal phase of contrast-enhanced CT demonstrating the left portal vein tumor thrombus (white arrow).
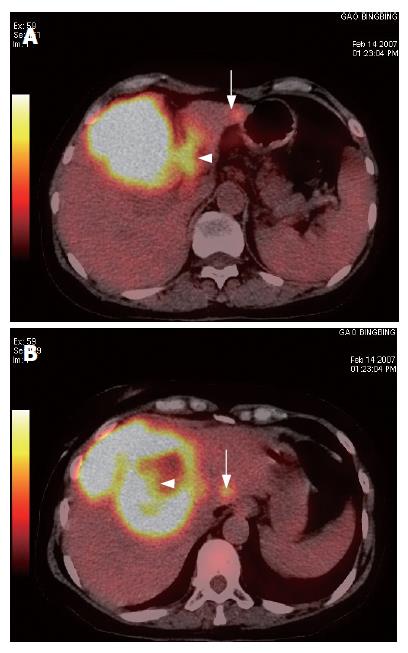
Figure 2 A: Integrated PET/CT image showing high FDG uptake by tumor thrombus in the left portal vein (arrow head) and a liver mass with a satellite lesion (arrow); B: Fused PET/CT imaging showing necrosis in the center of the mass (arrow head) with a satellite lesion (arrow).
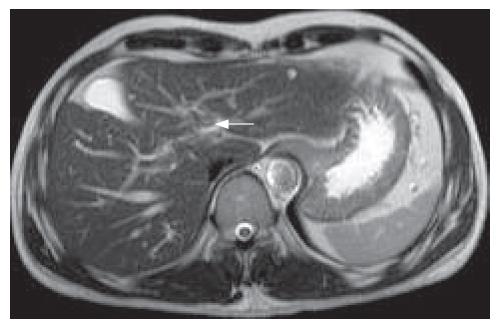
Figure 3 MRI T2 imaging showing a thrombus in the left portal vein.
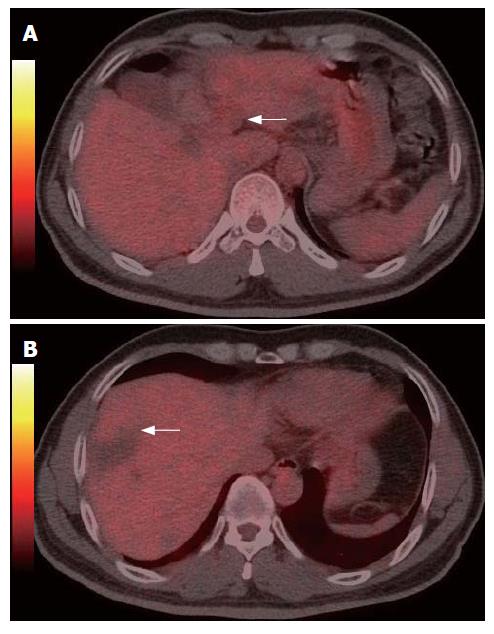
Figure 4 Fused PET/CT imaging showing no hypermetabolism (arrow) in the region of the left portal vein (A) and in the region of previous hepatic resection (B).
- Citation: Sun L, Wu H, Pan WM, Guan YS. Positron emission tomography/computed tomography with 18F-fluorodeoxyglucose identifies tumor growth or thrombosis in the portal vein with hepatocellular carcinoma. World J Gastroenterol 2007; 13(33): 4529-4532
- URL: https://www.wjgnet.com/1007-9327/full/v13/i33/4529.htm
- DOI: https://dx.doi.org/10.3748/wjg.v13.i33.4529


