Copyright
©2007 Baishideng Publishing Group Co.
World J Gastroenterol. Aug 7, 2007; 13(29): 4011-4014
Published online Aug 7, 2007. doi: 10.3748/wjg.v13.i29.4011
Published online Aug 7, 2007. doi: 10.3748/wjg.v13.i29.4011
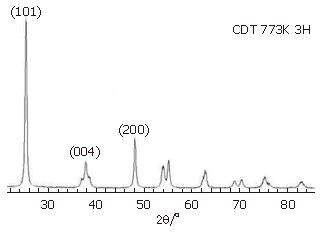
Figure 1 XRD spectra of CDT calcined at 500°C for 3 h.
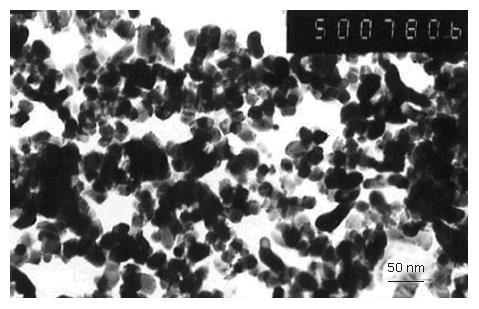
Figure 2 TEM of CDT.
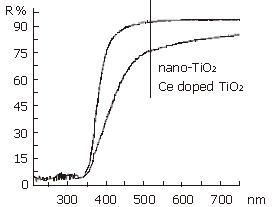
Figure 3 UV-Vis reflectance spectra of pure nano-TiO2 and CDT.
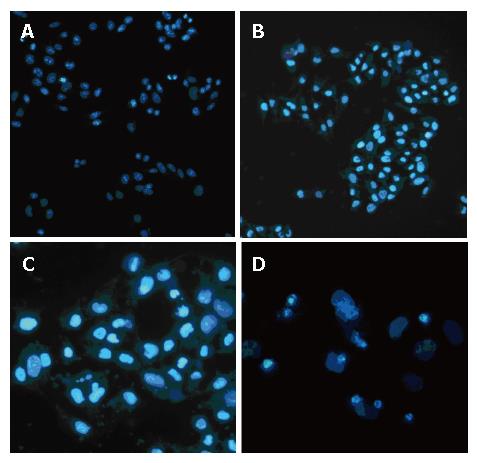
Figure 4 Fluorescence morphology of Bel 7402 cells treated with Ce (IV) doped nanometer titanium dioxide and stained with Hoechest 33 258.
A: CDT 10 μg/cm3, without light irradiation, × 200; B: Light irradiation, × 200; C: CDT (10 μg/cm3 illuminated for 10 min and incubated for 4 h), × 400; D: Cells exposed to CDT (10 μg/cm3 illuminated for 10 min and incubated overnight), × 400.
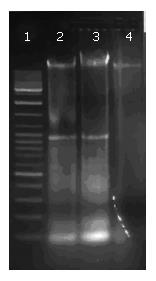
Figure 5 Agarose gel electrophoresis of DNA from Bel 7402 cells irradiated with visible light for 10 min.
Lane 2: 10 μg/cm3; lane 3: 5 μg/cm3; lane 4: Bel 7402 cells in the presence of light as control; lane 1: DNA marker (100 base pairs).
- Citation: Wang L, Mao J, Zhang GH, Tu MJ. Nano-cerium-element-doped titanium dioxide induces apoptosis of Bel 7402 human hepatoma cells in the presence of visible light. World J Gastroenterol 2007; 13(29): 4011-4014
- URL: https://www.wjgnet.com/1007-9327/full/v13/i29/4011.htm
- DOI: https://dx.doi.org/10.3748/wjg.v13.i29.4011


