Copyright
©2007 Baishideng Publishing Group Co.
World J Gastroenterol. Jun 14, 2007; 13(22): 3071-3079
Published online Jun 14, 2007. doi: 10.3748/wjg.v13.i22.3071
Published online Jun 14, 2007. doi: 10.3748/wjg.v13.i22.3071
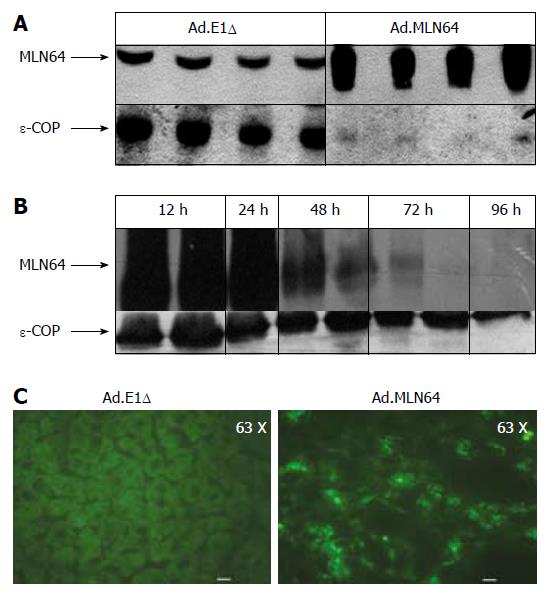
Figure 1 Effect of recombinant MLN64 adenovirus infection on MLN64 expression in mice livers.
A: Immunoblot analysis of MLN64. At 24 h after infection, mitochondria/lysosome enriched extracts (50 μg protein/lane from Ad.E1Δ and 1 μg protein/lane from Ad.MLN64 mouse livers) were subjected to 10% SDS-PAGE and Western blotting with anti-MLN64 and anti-ε-COP antibodies; B: Time course of hepatic MLN64 expression after administration of recombinant adenovirus. At the indicated times (in hours) after infection, livers were collected and analyzed for MLN64 protein expression in total membrane extracts as described in (A); C: Immunofluorescence analysis of liver tissue 24 h after infection with control (Ad.E1Δ) or MLN64 (Ad.MLN64) recombinant adenovirus. Bar: 10 μm. Analysis were performed in four mice in each experimental group. Results are representative of three independent experiments.
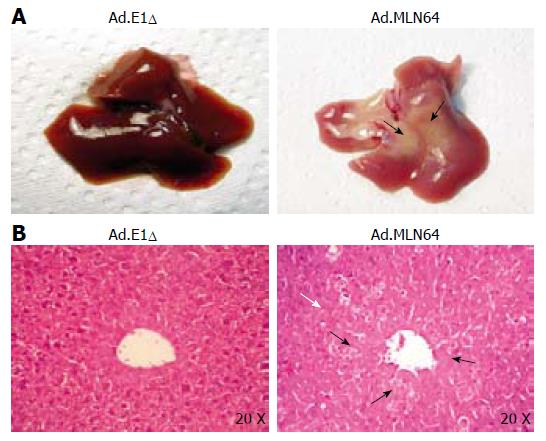
Figure 2 Effect of recombinant MLN64 adenovirus infection on liver morphology and histology in mice.
A: Gross morphology of murine livers 24 h after infection with Ad.E1Δ or Ad.MLN64. Arrows indicate yellowish-white zones with liver necrosis in Ad.MLN64-infected mice; B: Liver sections from (A) were prepared for histology and stained with hematoxylin and eosin. Small arrows indicate necrotic zones, and the white arrow indicates an apoptotic zone. Analysis were performed in four mice in each experimental group. Results are representative of three independent experiments.
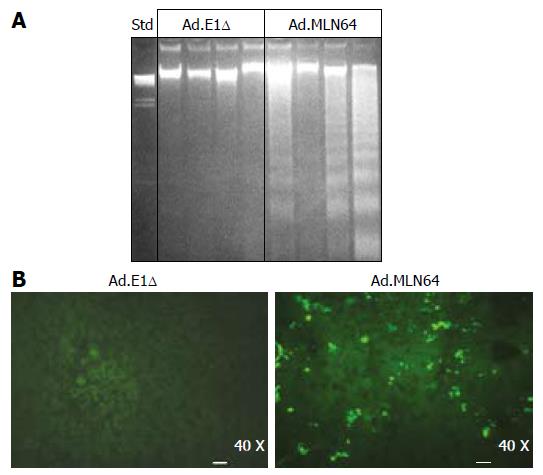
Figure 3 Effect of recombinant MLN64 adenovirus infection on liver apoptosis in mice.
DNA fragmentation analysis and TUNEL assay were performed in murine livers 24 h after infection with Ad.E1Δ or Ad.MLN64 as biochemical markers of apoptosis. A: DNA fragmentation analysis of liver tissue by DNA agarose gel electrophoresis. DNA λ/Hind III was used as the standard (Std); B: TUNEL assay. Substantially more apoptotic cells were detected in liver sections from Ad.MLN64-infected mice than in those from Ad.E1Δ-infected mice. Analysis were performed in four mice in each experimental group. Results are representative of three independent experiments.
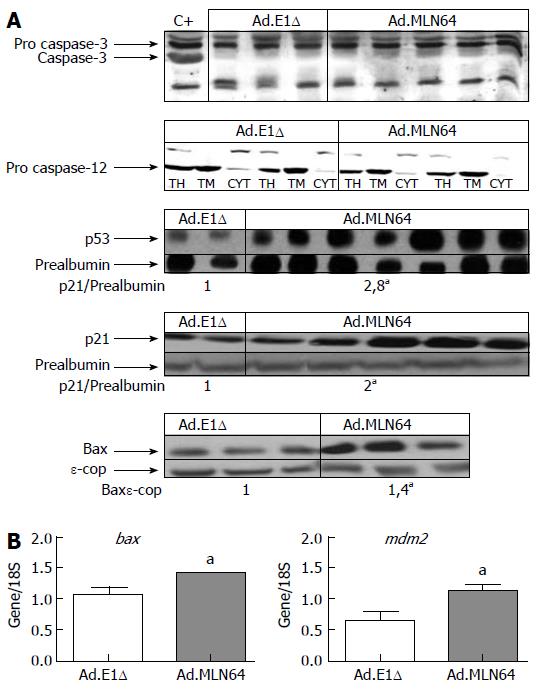
Figure 4 Effect of recombinant MLN64 adenovirus infection on hepatic expressions of various apoptosis-regulating genes in mice.
A: For caspase-3 analysis, liver cytosolic fractions were prepared from Ad.MLN64-infected mice, and a liver cytosolic fraction from a CDCA-fed mouse was used as a positive control (C+). For caspase-12 analysis, liver homogenates (TH) from two mice in each group were fractionated into total membranes (TM) and cytosol (CYT). Total liver extracts were prepared for the analysis of p53, p21, and Bax expressions. Proteins were size fractionated by SDS-PAGE, immunoblotted with anti-caspase-3, anti-caspase-12, anti-p53, anti-p21, and anti-Bax antibodies, and subjected to densitometric analysis. The protein expression data are shown after normalization to the ε-COP or albumin signal. aP < 0.05; B: Relative quantitative RT-PCR in the presence of [α-32P]dCTP was used to analyze the bax and mdm2 RNA expressions. A 18S primer control was included in each sample. The products were resolved on a 1.5% agarose gel and transferred to a nylon filter, and the radiolabeled signals were quantified. Results are representative of three independent experiments. aP < 0.05.
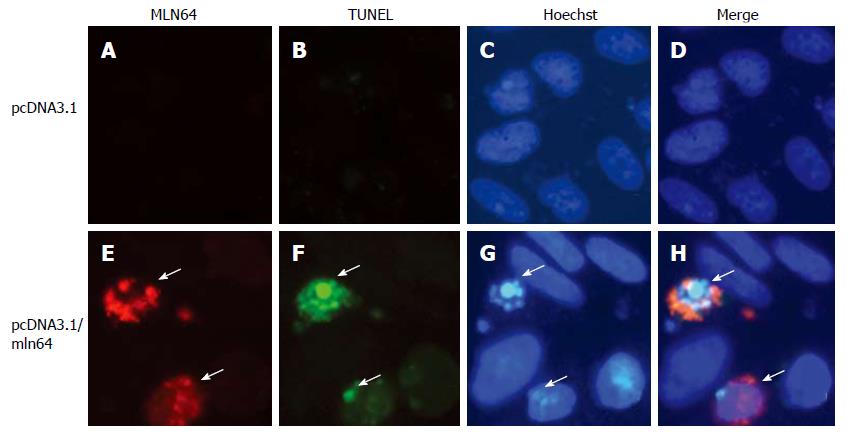
Figure 5 Effect of MLN64 over expression on apoptosis in CHO cells.
CHO-K1 cells were transfected with a pcDNA3.1 empty or a pcDNA3.1/MLN64 vector, analyzed by MLN64 immunofluorescence (A, E), TUNEL (B, F), or Hoechst 33258 (C, G) staining, and visualized under fluorescence microscopy. Merge of panels A, B and C and E, F and G are shown in panels D and H. Arrows indicate MLN64 overexpressing cells.
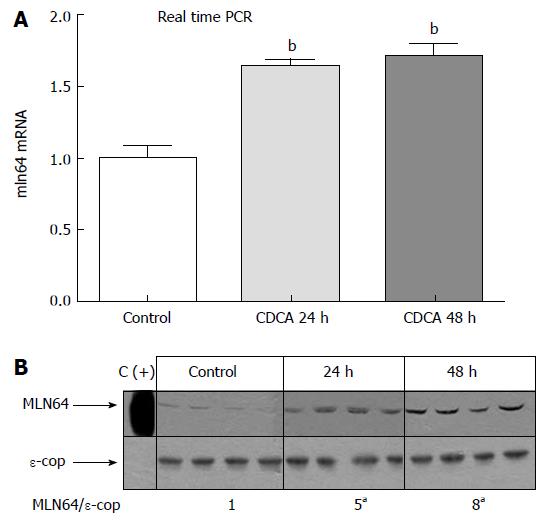
Figure 6 Effect of a 2% CDCA diet on hepatic MLN64 mRNA and protein levels in mice.
Mice were fed with a 2% CDCA diet for 1 or 2 d. A: Real time PCR was used to analyze mln64 RNA expression. Each value represents the mean ± SE for mRNA values determined in CDCA-fed mice relative to those measured in chow diet-fed mice. There were 5 mice in each group. bP < 0.0001; B: Immunoblot analysis of MLN64. Mitochondria-enriched liver extracts (50 μg protein/lane) were subjected to 10% SDS-PAGE and Western blotting with anti-MLN64 and anti-ε-COP antibodies. A liver membrane fraction from an Ad.MLN64-infected mouse was used as a positive control (C+). aP < 0.05.
- Citation: Tichauer JE, Morales MG, Amigo L, Galdames L, Klein A, Quiñones V, Ferrada C, R AA, Rio MC, Miquel JF, Rigotti A, Zanlungo S. Overexpression of the cholesterol-binding protein MLN64 induces liver damage in the mouse. World J Gastroenterol 2007; 13(22): 3071-3079
- URL: https://www.wjgnet.com/1007-9327/full/v13/i22/3071.htm
- DOI: https://dx.doi.org/10.3748/wjg.v13.i22.3071


