Copyright
©2007 Baishideng Publishing Group Co.
World J Gastroenterol. Jun 7, 2007; 13(21): 2939-2944
Published online Jun 7, 2007. doi: 10.3748/wjg.v13.i21.2939
Published online Jun 7, 2007. doi: 10.3748/wjg.v13.i21.2939
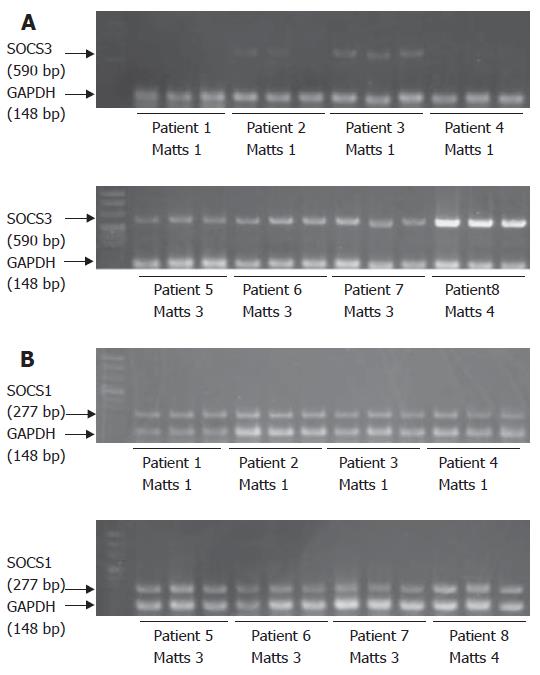
Figure 1 Expression of SOCS3 (A) and SOCS1 (B) mRNA in the colonic mucosa with UC.
PCR was performed in triplicate for each sample. GAPDH was included as an internal control for efficiency of RT and amount of RNA. The colonic mucosae in cases 1 to 4 were shown endoscopically to be in remission and those in cases 5 to 8 were shown endoscopically to be active.
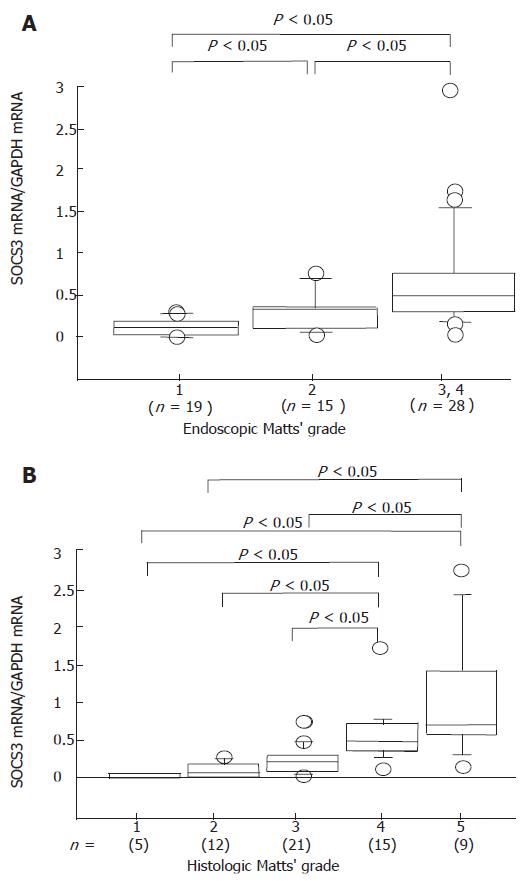
Figure 2 Relation between the degree of endoscopic (A) and histologic (B) inflammation and levels of SOCS3.
The levels of SOCS3 mRNA were determined by quantitative RT-PCR. Box graphic top, bottom, and middle correspond to 75th, 25th, and 50th percentiles (median), respectively. Bar shows 5th and 95th percentiles. The mean + SD of endoscopic Matts’ grade was 0.116 + 0.094 for Matts'1, 0.280 + 0.219 for Matts'2, and 0.673 + 0.599 for Matts'3 and 4. The mean + SD of histologic Matts’ grade was 0.038 + 0.048 for Matts’1, 0.124 + 0.102 for Matts'2, 0.250 + 0.174 for Matts'3, 0.597 + 0.371 for Matts'4, and 1.039 + 0.821 for Matts'5. There was a significant correlation between SOCS3 expression in the colonic mucosa and Matts’ grade.
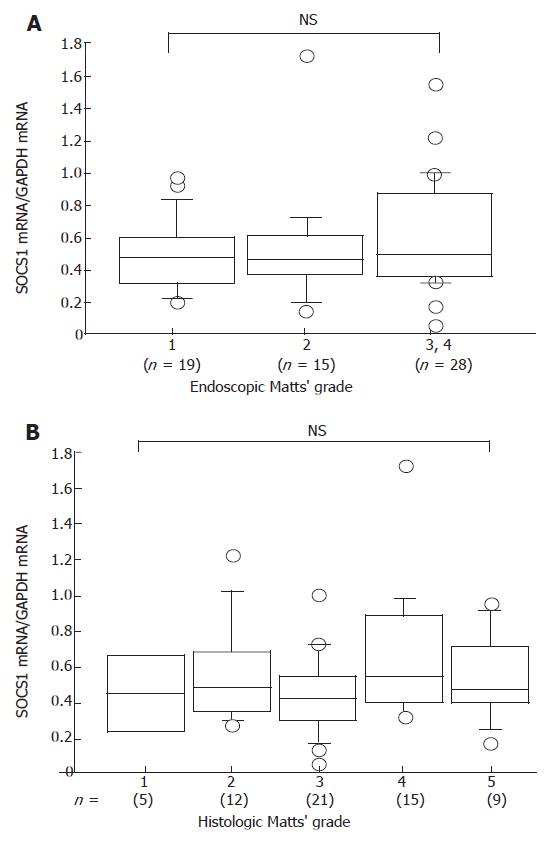
Figure 3 Relation between the degree of endoscopic (A) and histologic (B) inflammation and expression of SOCS1.
Levels of SOCS1 mRNA were determined by quantitative RT-PCR. There was no correlation between the degree of inflammation and mucosal SOCS1 mRNA level.
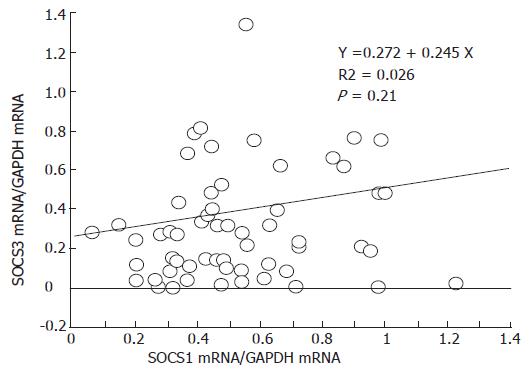
Figure 4 Relation between expression of SOCS1 and SOCS3 mRNAs.
SOCS1 mRNA expression was not correlated with SOCS3 mRNA expression in colonic biopsy specimens.
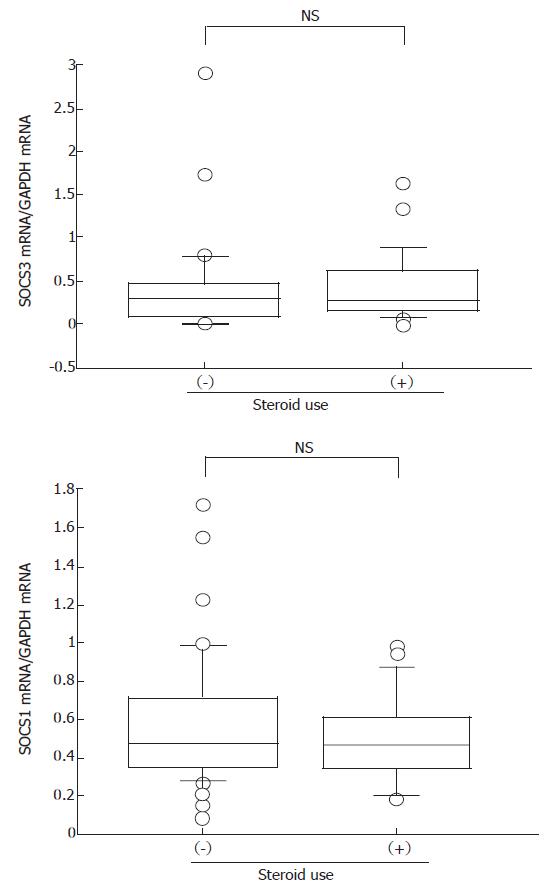
Figure 5 Effect of steroid treatment on expression of SOCS mRNAs.
SOCS1 and SOCS3 levels tended to decrease in response to steroid treatment. NS: not significant.
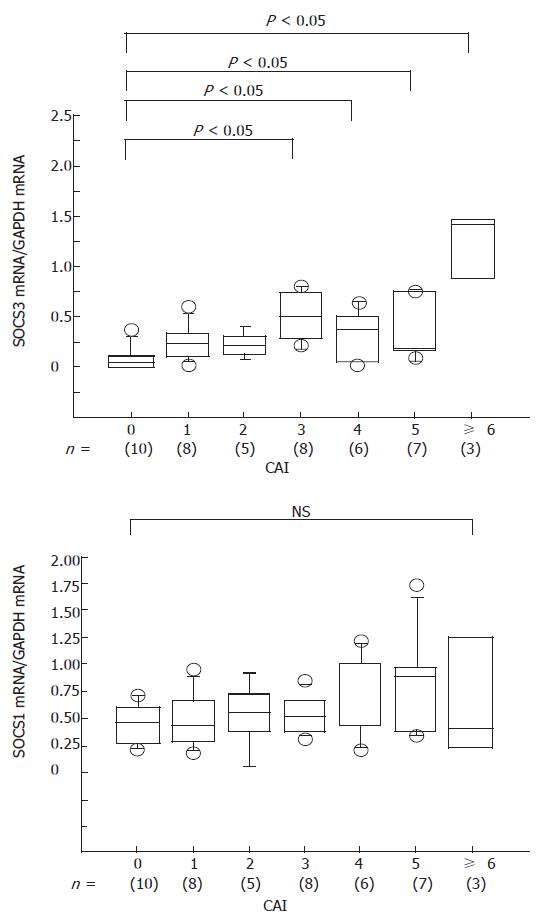
Figure 6 Relation between expression of SOCS mRNAs and CAI.
SOCS3 expression is well correlated with CAI. There was no correlation between SOCS1 expression and CAI. NS: not significant.
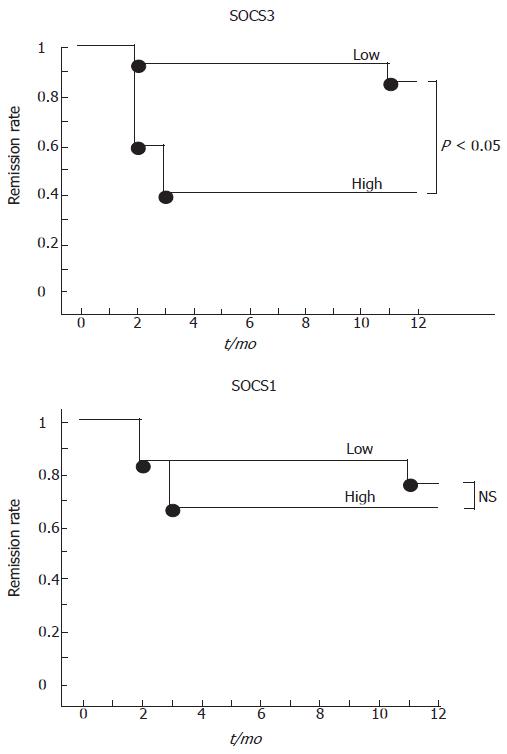
Figure 7 Kaplan-Meier time to relapse curves for patients with UC in relation to the expression of SOCS mRNAs.
There is a significant difference (P < 0.05, log rank) in the proportion of patients who relapsed over a 12-mo period with respect to the levels of mucosal SOCS3 (> or < 0.3) at time of inclusion in the study. There was no correlation between SOCS1 and remission rate. NS: not significant.
- Citation: Miyanaka Y, Ueno Y, Tanaka S, Yoshioka K, Hatakeyama T, Shimamoto M, Sumii M, Chayama K. Clinical significance of mucosal suppressors of cytokine signaling 3 expression in ulcerative colitis. World J Gastroenterol 2007; 13(21): 2939-2944
- URL: https://www.wjgnet.com/1007-9327/full/v13/i21/2939.htm
- DOI: https://dx.doi.org/10.3748/wjg.v13.i21.2939


