Copyright
©2007 Baishideng Publishing Group Co.
World J Gastroenterol. Jan 14, 2007; 13(2): 280-284
Published online Jan 14, 2007. doi: 10.3748/wjg.v13.i2.280
Published online Jan 14, 2007. doi: 10.3748/wjg.v13.i2.280
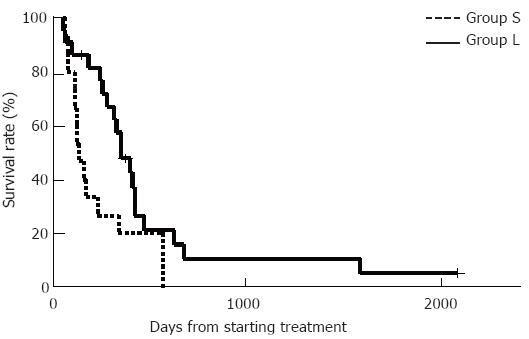
Figure 1 Survival curves plotted by the Kaplan-Meier method.
The survival of group L was significantly better than that of group S. The median survival time was 496 d in group L versus 226 d in group S (aP < 0.05, Kaplan-Meier method and log-rank test).
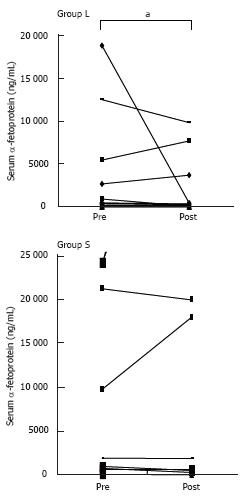
Figure 2 Changes of serum AFP following treatment in the both groups.
In group L, the serum AFP level decreased significantly after treatment compared with before treatment (aP < 0.05, Mann-Whitney test).
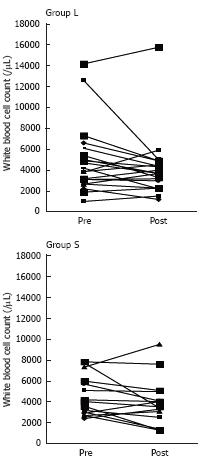
Figure 3 Changes of the white blood cell count following treatment in the both groups.
There were no significant differences in either group.
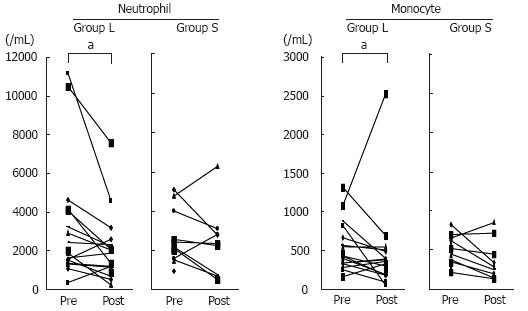
Figure 4 Changes of neutrophil and monocyte counts following treatment in the both groups.
In group L, the neutrophil and monocyte counts were significantly decreased after treatment as compared with before treatment (aP < 0.05, Mann-Whitney test).
- Citation: Nagai H, Kanayama M, Higami K, Momiyama K, Ikoma A, Okano N, Matsumaru K, Watanabe M, Ishii K, Sumino Y, Miki K. Twenty-four hour intra-arterial infusion of 5-fluorouracil, cisplatin, and leucovorin is more effective than 6-hour infusion for advanced hepatocellular carcinoma. World J Gastroenterol 2007; 13(2): 280-284
- URL: https://www.wjgnet.com/1007-9327/full/v13/i2/280.htm
- DOI: https://dx.doi.org/10.3748/wjg.v13.i2.280


