Copyright
©2007 Baishideng Publishing Group Co.
World J Gastroenterol. Jan 14, 2007; 13(2): 257-263
Published online Jan 14, 2007. doi: 10.3748/wjg.v13.i2.257
Published online Jan 14, 2007. doi: 10.3748/wjg.v13.i2.257
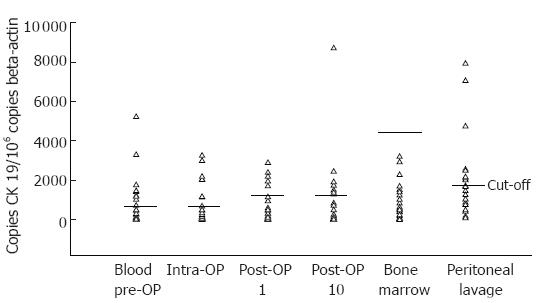
Figure 1 Quantitative values of cytokeratin-19 transcription in blood, bone marrow and peritoneal lavage of the patients with pancreatic cancer.
1Cut-off: Maximal expression of CK-19 mRNA in healthy control patients.
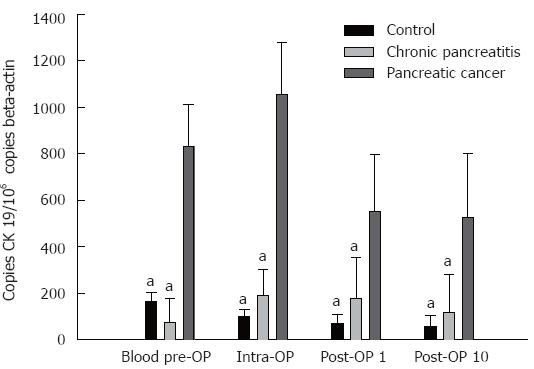
Figure 2 Quantitative analysis of CK-19 expression in blood (mean ± SD).
aP < 0.05 vs pancreatic cancer.
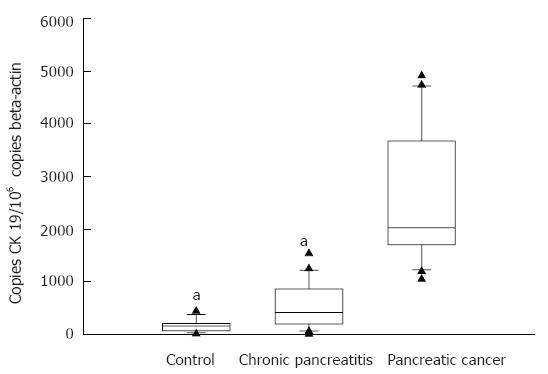
Figure 3 Quantitative CK-19 expression in peritoneal lavage of the patients with pancreatic cancer (mean ± SD, aP < 0.
05 vs pancreatic cancer).
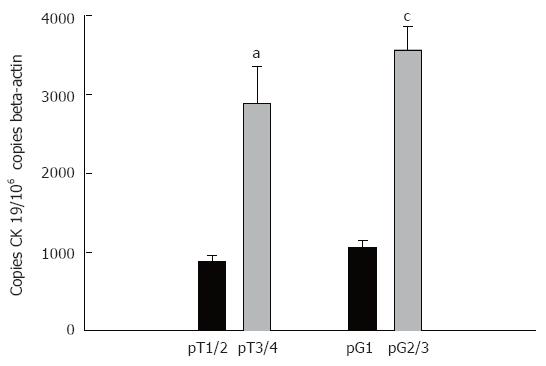
Figure 4 Quantitative CK-19 expression in peritoneal lavage of the patients with tumors (mean ± SD).
aP < 0.05 vs pT1/2; cP < 0.05 vs pG1.
- Citation: Hoffmann K, Kerner C, Wilfert W, Mueller M, Thiery J, Hauss J, Witzigmann H. Detection of disseminated pancreatic cells by amplification of cytokeratin-19 with quantitative RT-PCR in blood, bone marrow and peritoneal lavage of pancreatic carcinoma patients. World J Gastroenterol 2007; 13(2): 257-263
- URL: https://www.wjgnet.com/1007-9327/full/v13/i2/257.htm
- DOI: https://dx.doi.org/10.3748/wjg.v13.i2.257


