Copyright
©2007 Baishideng Publishing Group Co.
World J Gastroenterol. Apr 21, 2007; 13(15): 2160-2165
Published online Apr 21, 2007. doi: 10.3748/wjg.v13.i15.2160
Published online Apr 21, 2007. doi: 10.3748/wjg.v13.i15.2160
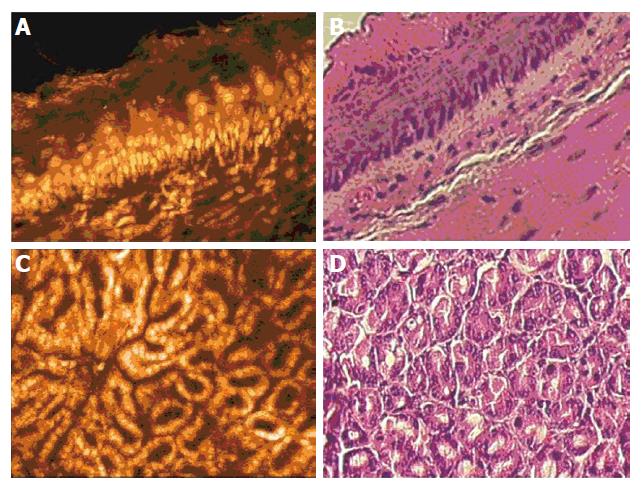
Figure 1 A: Esophagus after intravenous injection of acriflavine hydrochloride: The germinative zone and the columnar arrangement within the layered structure can be easily visualized.
Note that the mouse esophagus is keratinized; B: Ex vivo H&E staining of the corresponding specimen; C: In vivo visualization of gastric glands. Note the dos-à-dos-arrangement of the glands. Only scarce nuclei stain within the loose connective tissue of the lamina propria; D: Corresponding specimen of the mouse stomach in a transverse section.
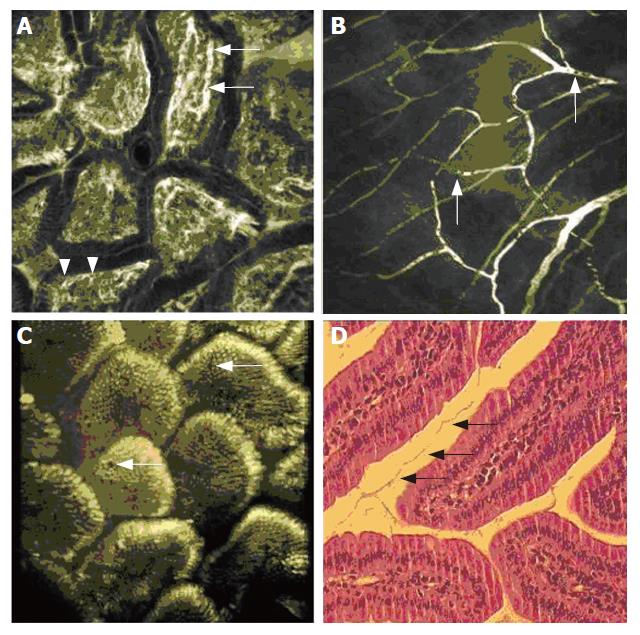
Figure 2 A: Duodenal villi after intravenous injection of FITC-labelled dextran.
Capillaries are brightly contrasted, while blood cells are rendered as black dots within the lumen (arrow). Vessel loops are situated close to the clear cut basal border of columnar epithelial cells (arrow head); B: After acriflavine application, the regular distribution of enterocytes on the villi is visualized. Interspersed are multiple goblet cells in which the mucin is only weakly stained (arrows). A still from a three-dimensional reconstruction of 21 serial transverse sections is rendered, the full reconstruction is given as a video file as Suppl. Figure 1; C: In the corresponding H&E stained specimen, the villi seem to be set further apart. The mucus filaments (arrows) probably indicate the prior extent of the villi, illustrating the range of shrinking artifacts upon fixation; D: In the fine vessel structure of the small intestinal meso, blood plasma is brightly contrasted after injection of FITC-labeled dextran. Black inclusions within the plasma flow correspond to unstained blood cells (arrows).
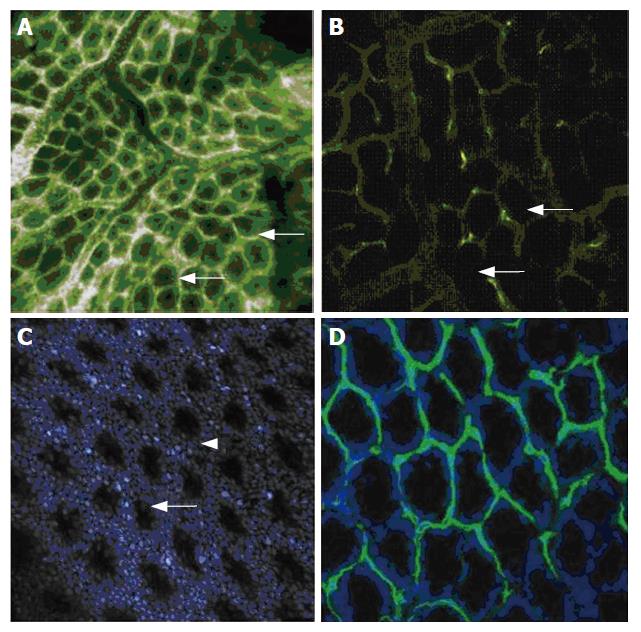
Figure 3 A: Intravenous fluorescein sodium gives a thorough impression of the colonic mucosa.
The crypt lumina are still visible within, although at this tissue depth (about 150 μm), sub cellular details such as mucin in goblet cells can no longer be displayed. Larger vessels drain and feed the capillaries, which are rendered as white bands (arrows) surrounding the tightly packed crypts; B: After intravenous injection of FITC-labelled L. esculentum lectin, fluorescent labelling of the endothelial cells results in a selective staining of the capillary walls of the colonic mucosa. The enterocytes and goblet cells of the crypt itself (arrows) are not visualized; C: After injection of acriflavine, visualization of the epithelial cell nuclei renders the regular pattern of crypts in normal colonic mucosa. Cells are captured either en face (in-between crypts, arrow) or transverse (in the pits, arrowhead); D: For the bench-top confocal correlate, an ex vivo nuclear counter stain was performed with Hoechst blue, rendering the circular arrangement of basally oriented nuclei of the colonic crypts. The labelling of vessel walls was performed in vivo. This double staining corresponds to an ex vivo overlay of Figure 3B and C.
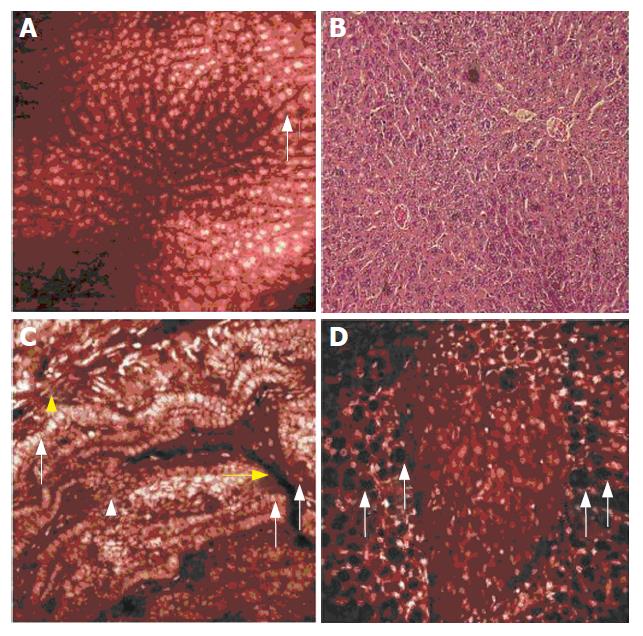
Figure 4 A: Hepatocyte nuclei stain bright after injection of acriflavine.
The cytoplasm is contrasted to a lesser extent, while the dye is completely removed from the sinusoids. Some hepatocytes show a distinct granular nuclear pattern (arrow), indicating nucleoli as uneven distribution of DNA within the nucleus; B: Corresponding liver specimen after H&E staining. Note that both sinusoids and central veins appear wider due to fixation artefacts; C: The complete gall bladder wall is visualized with acriflavine. Tall columnar cells line the folds at the luminal surface and are displayed at a transverse section (arrow) or en face (arrowhead). Vessel lumina can be identified by their endothelial lining (yellow arrows), and bands of smooth muscle cells are at the extraluminal tissue surface (yellow arrowhead); D: A patch of pancreatic tissue is visualized within the peripancreatic fatty tissue. The difference between the glandular parenchyma and the fat cells, which are identified by the black (fatty) intracellular inclusions (arrows) is apparent.
-
Citation: Goetz M, Memadathil B, Biesterfeld S, Schneider C, Gregor S, Galle PR, Neurath MF, Kiesslich R.
In vivo subsurface morphological and functional cellular and subcellular imaging of the gastrointestinal tract with confocal mini-microscopy. World J Gastroenterol 2007; 13(15): 2160-2165 - URL: https://www.wjgnet.com/1007-9327/full/v13/i15/2160.htm
- DOI: https://dx.doi.org/10.3748/wjg.v13.i15.2160


