Copyright
©The Author(s) 2007.
World J Gastroenterol. Apr 14, 2007; 13(14): 2118-2124
Published online Apr 14, 2007. doi: 10.3748/wjg.v13.i14.2118
Published online Apr 14, 2007. doi: 10.3748/wjg.v13.i14.2118
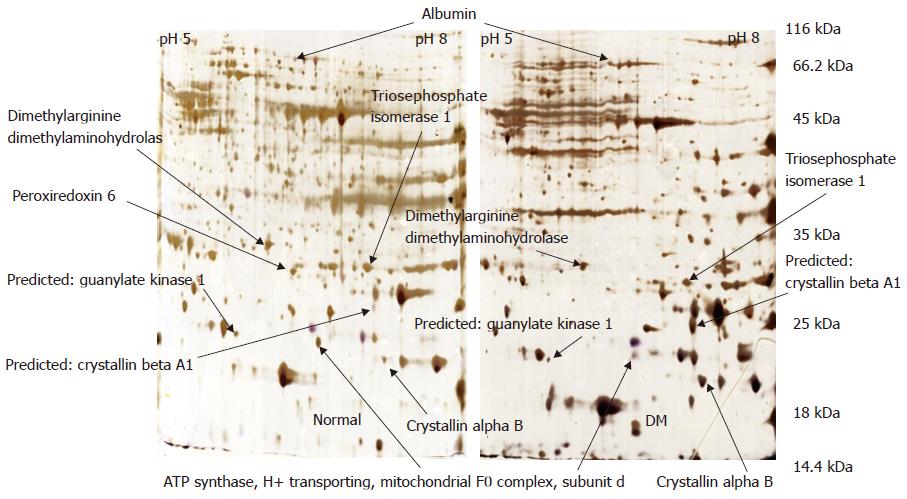
Figure 1 2-DE map of proteins in rat retinae.
2-DE was performed on an immobilized 17 cm pH 5-8 strip, followed by the second-dimensional separation on 12% poly-acrylamide gels. The separated proteins were stained with silver nitrate.
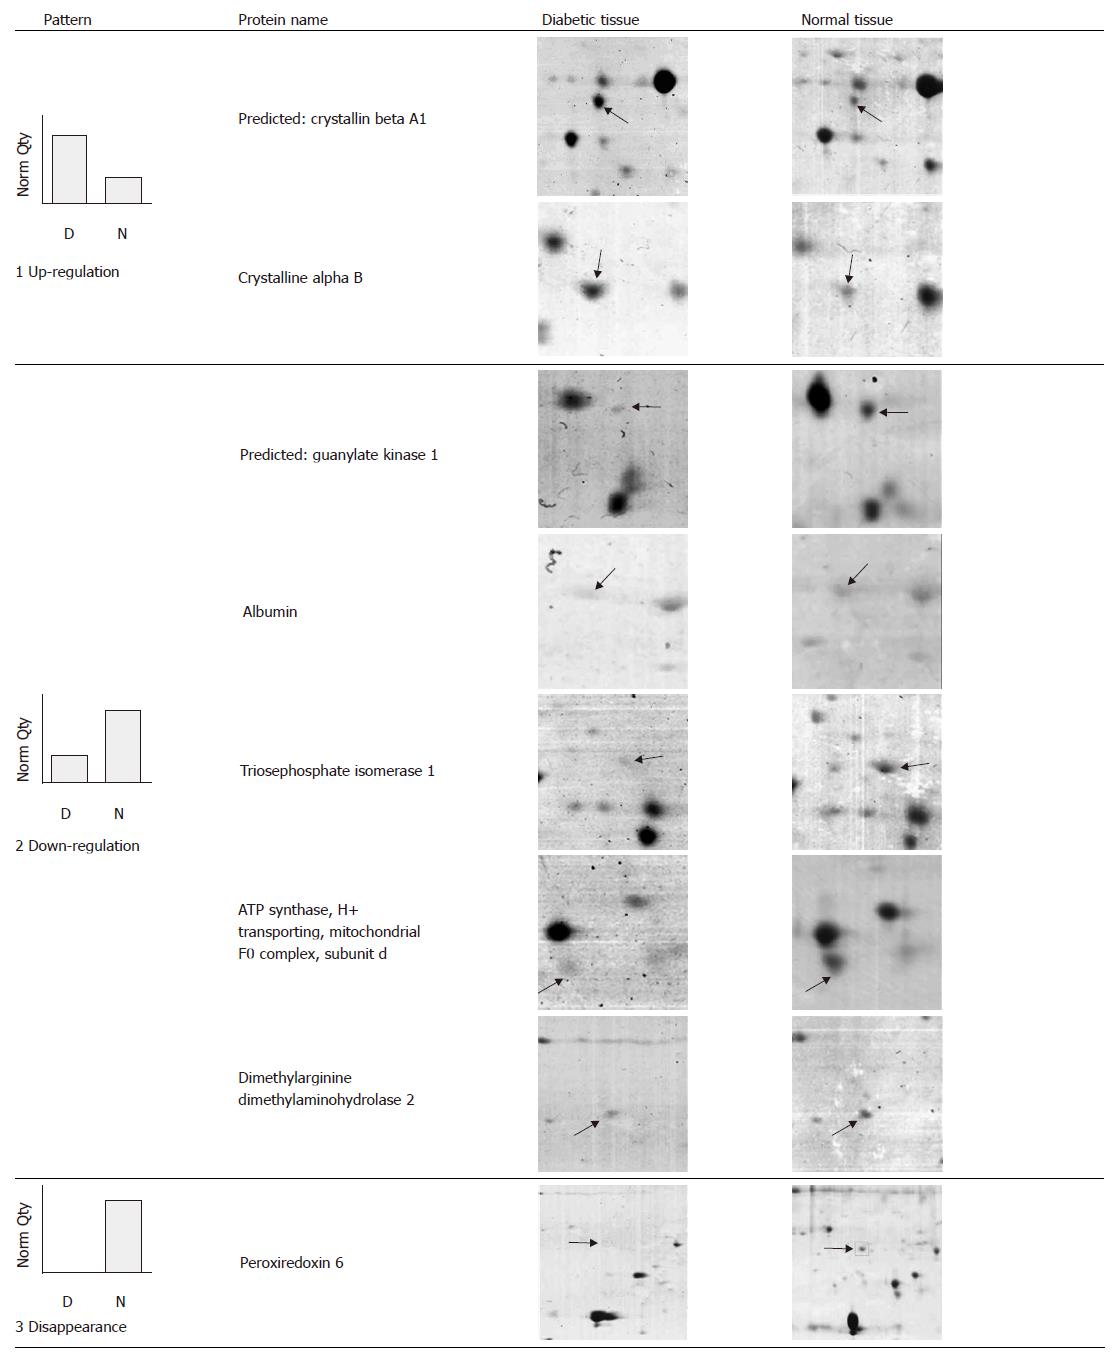
Figure 2 Types of protein expression patterns obtained from normal and diabetic retinal tissues and proteins pertaining to each pattern.
Norm Qty on the Y-axis stands for normalized quantity, D and N on the X-axis stand for diabetic and normal retinal tissue, respectively. The 8 proteins visualized by MS/MS were divided by expression pattern into pattern 1 through 3 and displayed by protein spots in 2-D gel.
- Citation: Liu SQ, Kang J, Li CJ, Tang EJ, Wen B, Cai R, Yang HJ. Differences in expression of retinal proteins between diabetic and normal rats. World J Gastroenterol 2007; 13(14): 2118-2124
- URL: https://www.wjgnet.com/1007-9327/full/v13/i14/2118.htm
- DOI: https://dx.doi.org/10.3748/wjg.v13.i14.2118


