Copyright
©2007 Baishideng Publishing Group Co.
World J Gastroenterol. Apr 14, 2007; 13(14): 2094-2099
Published online Apr 14, 2007. doi: 10.3748/wjg.v13.i14.2094
Published online Apr 14, 2007. doi: 10.3748/wjg.v13.i14.2094
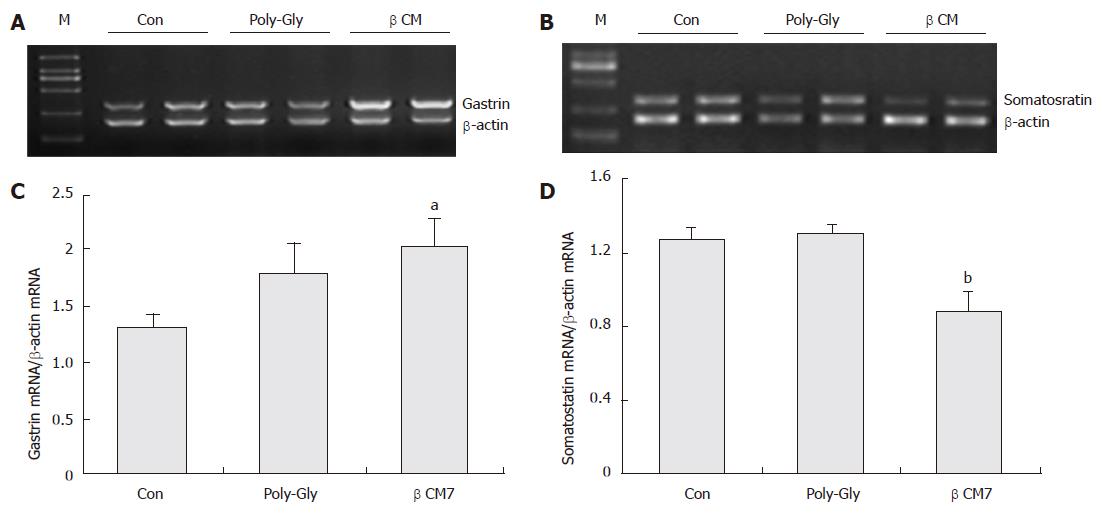
Figure 1 Effect of beta-casomorphin-7 on gastrin and somatostatin mRNA expression by RT-PCR.
(A) and (B): graphs of RT-PCR analysis. (C) and (D): densitometric analysis of somatostatin and gastrin signals over beta-actin signals. The vertical lines indicate the mean ± SE of three different experiments. aP < 0.05 vs control group, bP < 0.01 vs control group.
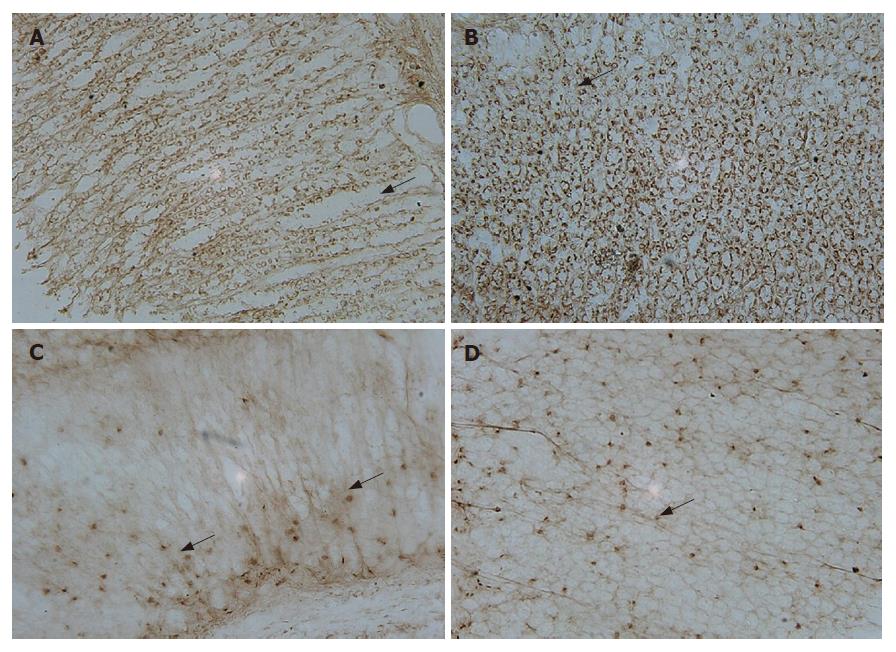
Figure 2 In situ hybridization for gastrin and somatostatin mRNA in rat gastric mu-cosa.
The oligonucleotide probes were labeled with digoxigenin. A: gastrin, corpus; B: gastrin, antrum; C: somatostatin, corpus; D: somatostatin, antrum. All of the sections magnify at 100 (10 × 10) and stained with DAB. The positive cells show brown precipitate at the site of digoxigenin-probe hybridization (black arrows).
- Citation: Zong YF, Chen WH, Zhang YS, Zou SX. Effects of intra-gastric beta-casomorphin-7 on somatostatin and gastrin gene expression in rat gastric mucosa. World J Gastroenterol 2007; 13(14): 2094-2099
- URL: https://www.wjgnet.com/1007-9327/full/v13/i14/2094.htm
- DOI: https://dx.doi.org/10.3748/wjg.v13.i14.2094


