Copyright
©2007 Baishideng Publishing Group Co.
World J Gastroenterol. Apr 14, 2007; 13(14): 2053-2060
Published online Apr 14, 2007. doi: 10.3748/wjg.v13.i14.2053
Published online Apr 14, 2007. doi: 10.3748/wjg.v13.i14.2053
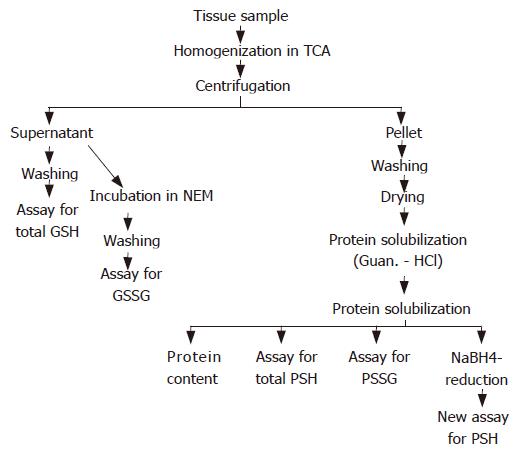
Figure 1 Flow diagram of sample preparation and measurement of thiols in the rat gastric mucosa and liver.
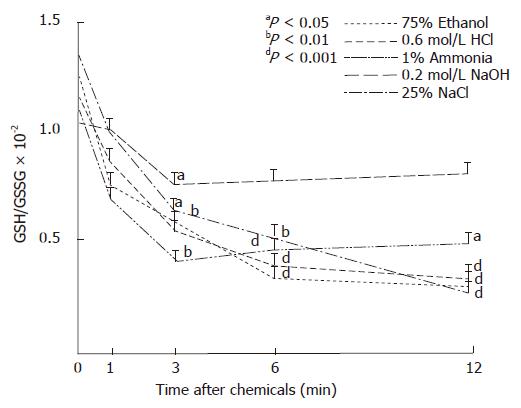
Figure 2 Ratios of reduced glutathione (GSH) and glutathione disulfide (GSSG) in mucosa of glandular stomach after i.
g. administration of gastrotoxic chemicals in rats.
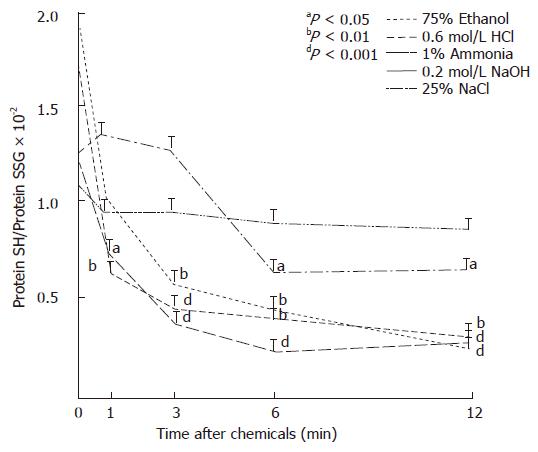
Figure 3 Ratios of protein SH (PSH) to protein-GSH mixed disulfides (PSSG) in the gastric mucosa after i.
g. administration of gastrotoxic chemicals in rats.
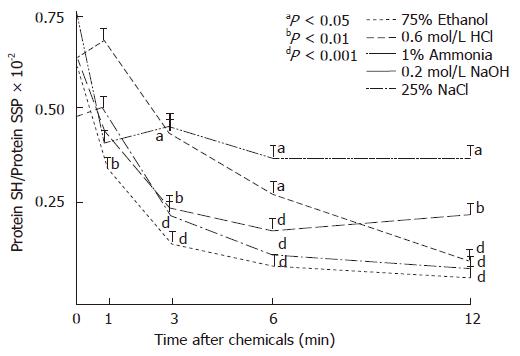
Figure 4 Ratios of protein SH (PSH) to protein disulfides (PSSP) in the gastric mucosa following i.
g. administration of gastrotoxic chemicals in rats.
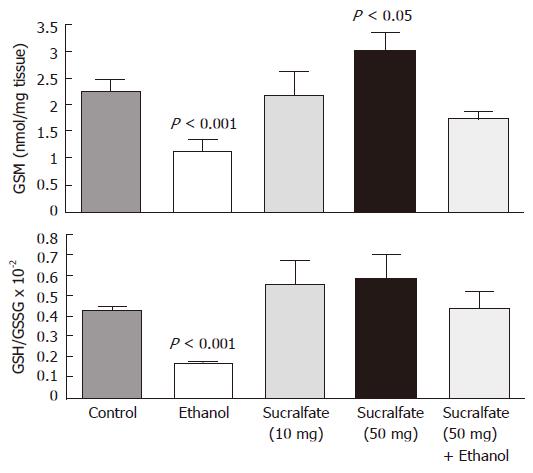
Figure 5 Concentration of GSH (nmol/mg tissue) and ratio of GSH/GSSG in the glandular mucosa of rat stomach after i.
g. administrations of sucralfate (10 and 50 mg/100 g, b.w.), 1 mL of 75% ethanol, and sucralfate (50 mg/100 g, b.w.) plus ethanol (n = 5). Data are expressed as means SEM.
- Citation: Nagy L, Nagata M, Szabo S. Protein and non-protein sulfhydryls and disulfides in gastric mucosa and liver after gastrotoxic chemicals and sucralfate: Possible new targets of pharmacologic agents. World J Gastroenterol 2007; 13(14): 2053-2060
- URL: https://www.wjgnet.com/1007-9327/full/v13/i14/2053.htm
- DOI: https://dx.doi.org/10.3748/wjg.v13.i14.2053


