Copyright
©2007 Baishideng Publishing Group Co.
World J Gastroenterol. Mar 21, 2007; 13(11): 1680-1686
Published online Mar 21, 2007. doi: 10.3748/wjg.v13.i11.1680
Published online Mar 21, 2007. doi: 10.3748/wjg.v13.i11.1680
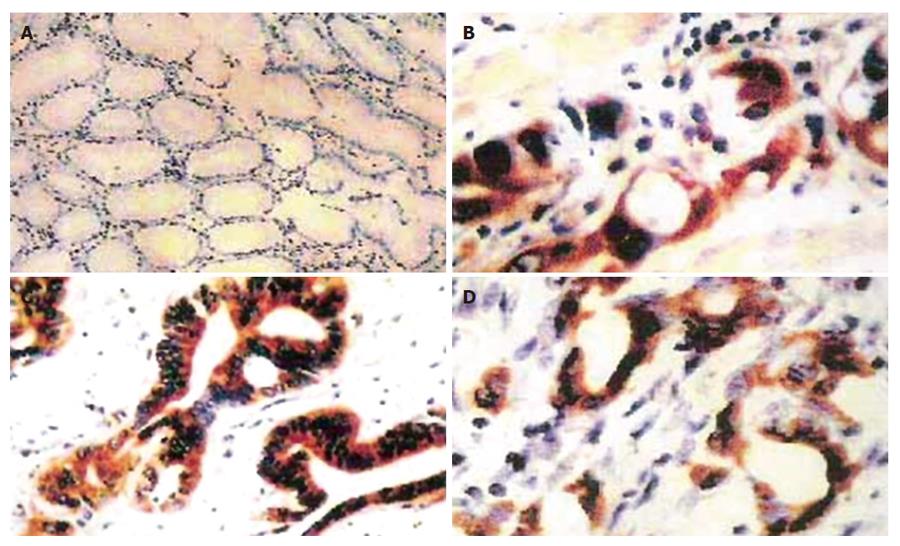
Figure 1 The expression of HIF-1α mRNA in gastric cancer tissue.
A: HIF-1α mRNA was negative (-) in nontumorous gastric epithelial mucous. In situ hybridization and visualization with DBA. Magnification × 120; B: Moderately differentiated adenocarcinoma was involved with muscular layer. HIF-1α mRNA was positively expressed (+++). In situ hybridization and visualization with DAB. Magnification × 180; C: Moderately differentiated adenocarcinoma was involved with serosa layer. HIF-1α mRNA was positively expressed (++). In situ hybridization and visualization with DAB. Magnification × 210; D: Moderately differentiated adenocarcinoma was involved with great omentum. HIF-1α mRNA was positively expressed (++). In situ hybridization and visualization with DAB. Magnification × 240.
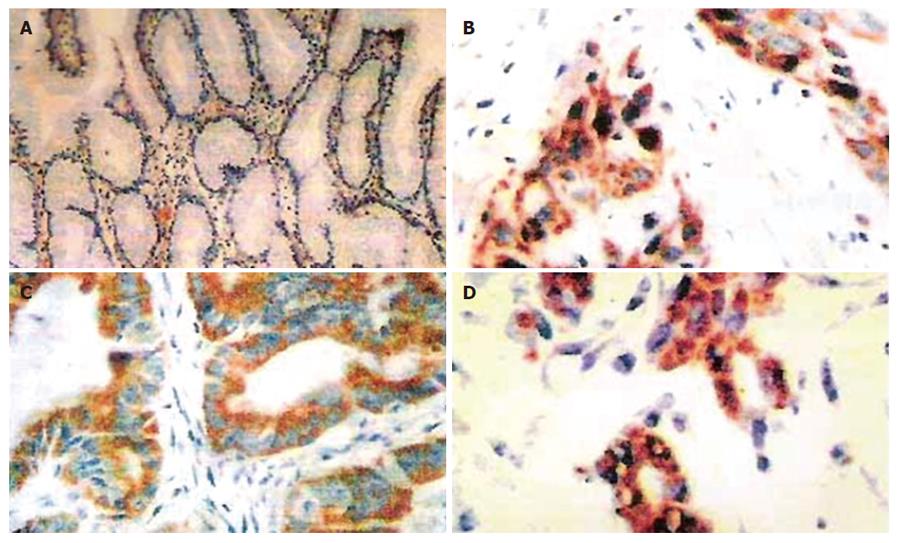
Figure 2 The expression of VEGF protein in gastric cancer tissue.
A: VEGF was negative (-) in nontumorous gastric epithelial mucous. In situ hybridization and visualization with DBA. Magnification × 120; B: Poorly differentiated adenocarcinoma was involved with muscular layer. VEGF was positively expressed (+++). In situ hybridization and visualization with DAB. Magnification ×180; C: Moderately differentiated adenocarcinoma was involved with serosa layer. HIF-1αmRNA was positively expressed (+++). In situ hybridization and visualization with DAB. Magnification × 200; D: Poorly differentiated adenocarcinoma was involved with great omentum. VEGF was positively expressed (++). In situ hybridization and visualization with DAB. Magnification × 220.
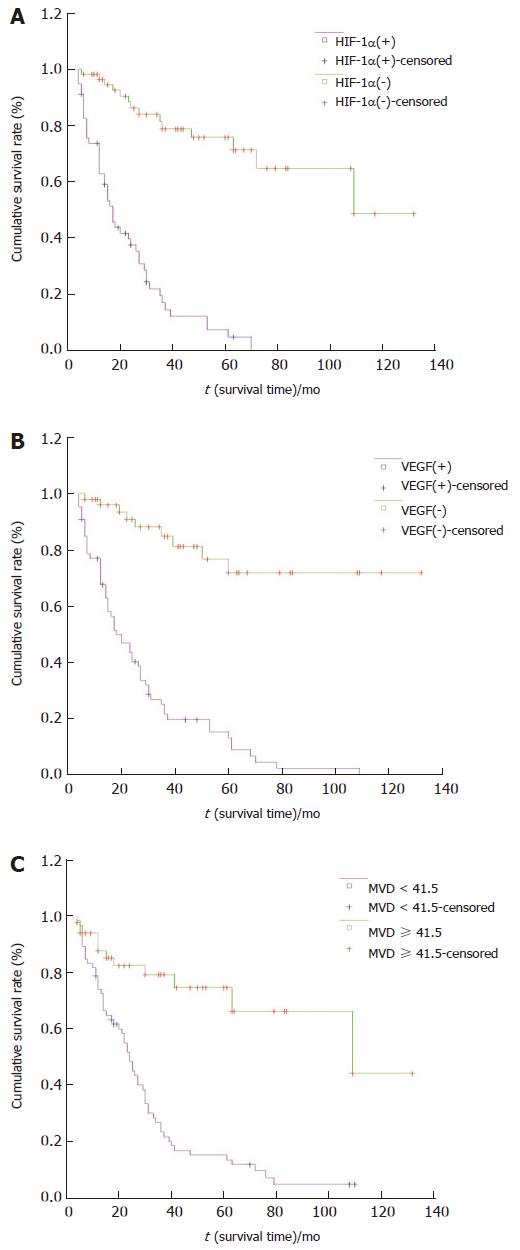
Figure 3 Relationship between HIF-1α mRNA, VEGF protein, MVD and prognosis.
A: Survival curves by the Kaplan-Meier method. Log-rank test revealing a significant difference between negative and positive expression of HIF-1α mRNA (P < 0.05); B: Survival curves based on the Kaplan-Meier method. Log-rank test revealing a significant difference between negative and positive expression of VEGF (P < 0.05); C: Survival curves by the Kaplan-Meier method. There was a significant difference in Log-rant test between patients with MVD value < 41.5/0.72 mm2 and those with MVD value ≥ 41.5/0.72 mm2.
- Citation: Ma J, Zhang L, Ru GQ, Zhao ZS, Xu WJ. Upregulation of hypoxia inducible factor 1α mRNA is associated with elevated vascular endothelial growth factor expression and excessive angiogenesis and predicts a poor prognosis in gastric carcinoma. World J Gastroenterol 2007; 13(11): 1680-1686
- URL: https://www.wjgnet.com/1007-9327/full/v13/i11/1680.htm
- DOI: https://dx.doi.org/10.3748/wjg.v13.i11.1680


