Copyright
©2006 Baishideng Publishing Group Co.
World J Gastroenterol. Mar 7, 2006; 12(9): 1421-1425
Published online Mar 7, 2006. doi: 10.3748/wjg.v12.i9.1421
Published online Mar 7, 2006. doi: 10.3748/wjg.v12.i9.1421
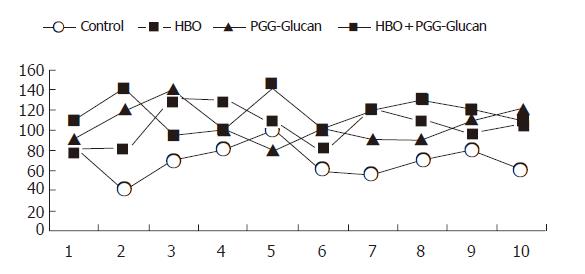
Figure 1 The burst pressure curves of rats for each group (mmHg).
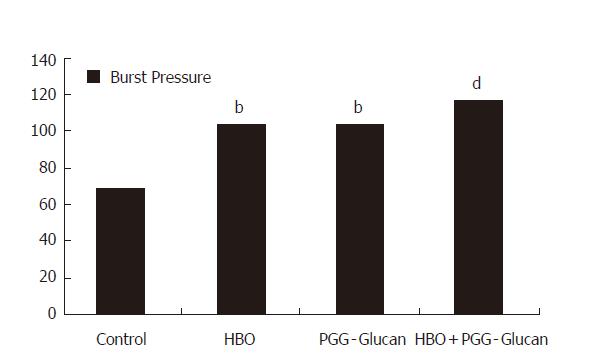
Figure 2 Burst pressure compartment between groups (mm/Hg).
bp < 0.01 significant compared to the control group. dp < 0.001 very significant compared to the control group.
Figure 3 Hydroxyproline level curves of rats for each group (mcg/mg wet tissue).
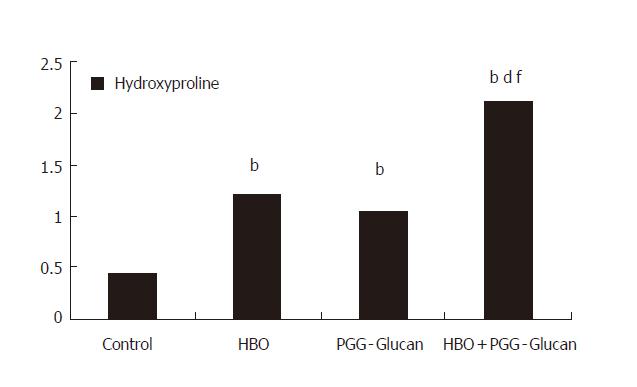
Figure 4 Comparison of Hydroxyproline levels (mcg/mg wet tissue).
bP < 0.001 very significant compared to the control group. dP < 0.001 very significant compared to HBO group. fP< 0.001 very significant compared to HBO+PGG-Glucan group.
- Citation: Guzel S, Sunamak O, AS A, Celik V, Ferahman M, Nuri MM, Gazioglu E, Atukeren P, Mutlu O. Effects of hyperbaric oxygen and Pgg-glucan on ischemic colon anastomosis. World J Gastroenterol 2006; 12(9): 1421-1425
- URL: https://www.wjgnet.com/1007-9327/full/v12/i9/1421.htm
- DOI: https://dx.doi.org/10.3748/wjg.v12.i9.1421


