Copyright
©2006 Baishideng Publishing Group Co.
World J Gastroenterol. Mar 7, 2006; 12(9): 1336-1345
Published online Mar 7, 2006. doi: 10.3748/wjg.v12.i9.1336
Published online Mar 7, 2006. doi: 10.3748/wjg.v12.i9.1336
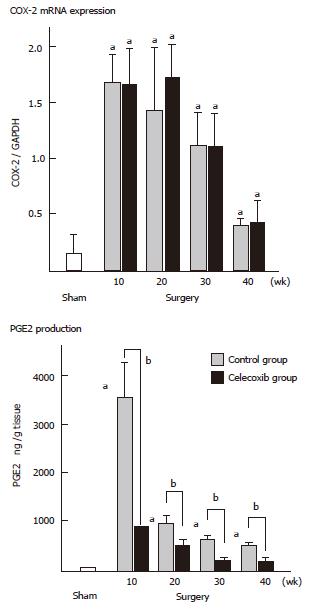
Figure 1 COX-2 mRNA expression and PGE2 production of esophageal mucosa.
aP < 0.005 vs sham; bP < 0.01 between the two groups , Mann-Whitney U test
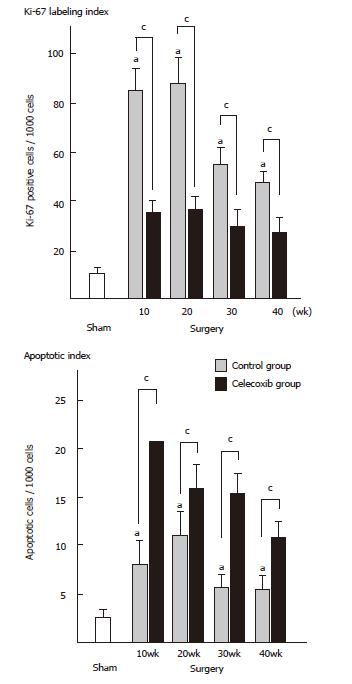
Figure 2 Cell kinetics of esophageal mucosa in a duodenoesophageal reflux model.
aP < 0.05 vs sham; cP < 0.05 between the two groups , Mann-Whitney U test
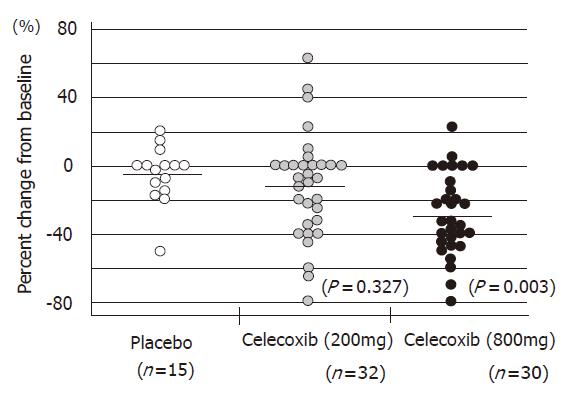
Figure 3 Percentage change from the baseline in the number of colorectal polyps in FAP patients
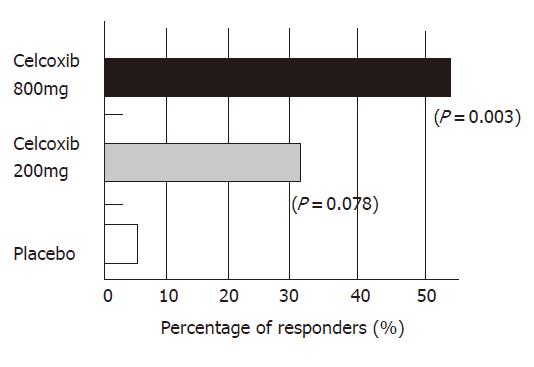
Figure 4 Percentage of responders who showed a 25% or more decrease in the mean number of colorectal polyps
- Citation: Fujimura T, Ohta T, Oyama K, Miyashita T, Miwa K. Role of cyclooxygenase-2 in the carcinogenesis of gastrointestinal tract cancers: A review and report of personal experience. World J Gastroenterol 2006; 12(9): 1336-1345
- URL: https://www.wjgnet.com/1007-9327/full/v12/i9/1336.htm
- DOI: https://dx.doi.org/10.3748/wjg.v12.i9.1336


