Copyright
©2006 Baishideng Publishing Group Co.
World J Gastroenterol. Feb 28, 2006; 12(8): 1225-1228
Published online Feb 28, 2006. doi: 10.3748/wjg.v12.i8.1225
Published online Feb 28, 2006. doi: 10.3748/wjg.v12.i8.1225
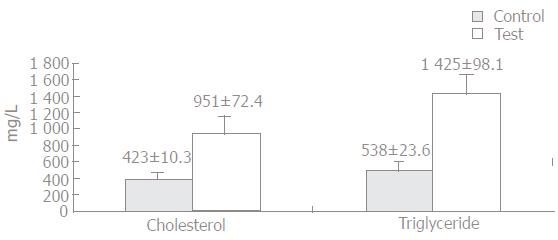
Figure 1 Mean cholesterol and triglyceride level in test and control groups.
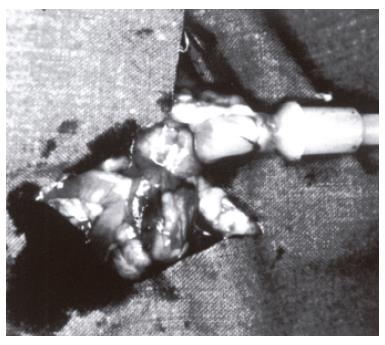
Figure 2 Insertion of an infusion pump into the colon.
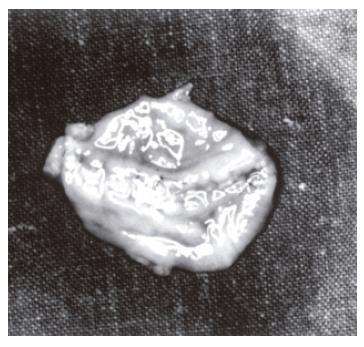
Figure 3 Anastomosis line.
Figure 4 Mean blow-out pressure (A) and hydroxyproline level (B) in test and control groups.
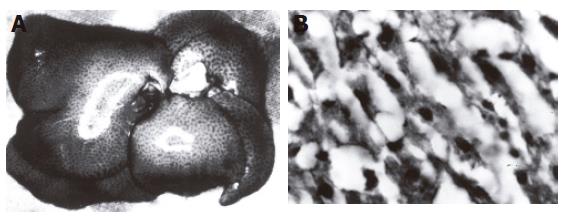
Figure 5 Macroscopic (A) and microscopic (B) steatosis in liver.
- Citation: Şen M, Anadol AZ, Oğuz M. Effect of hypercholesterolemia on experimental colonic anastomotic wound healing in rats. World J Gastroenterol 2006; 12(8): 1225-1228
- URL: https://www.wjgnet.com/1007-9327/full/v12/i8/1225.htm
- DOI: https://dx.doi.org/10.3748/wjg.v12.i8.1225


