Copyright
©2006 Baishideng Publishing Group Co.
World J Gastroenterol. Feb 28, 2006; 12(8): 1182-1186
Published online Feb 28, 2006. doi: 10.3748/wjg.v12.i8.1182
Published online Feb 28, 2006. doi: 10.3748/wjg.v12.i8.1182
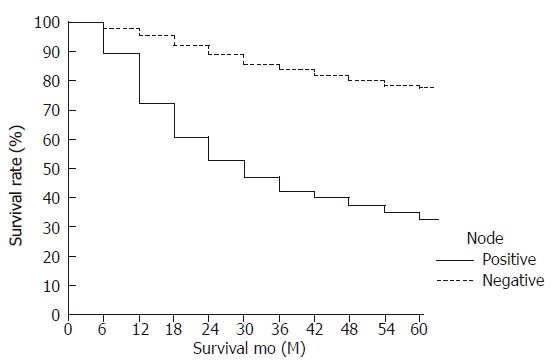
Figure 1 Survival curves of patients with lymph node-negative and node-positive gastric carcinoma (node-negative, 77.
4% vs node-positive, 31.1%) (P < 0.001).
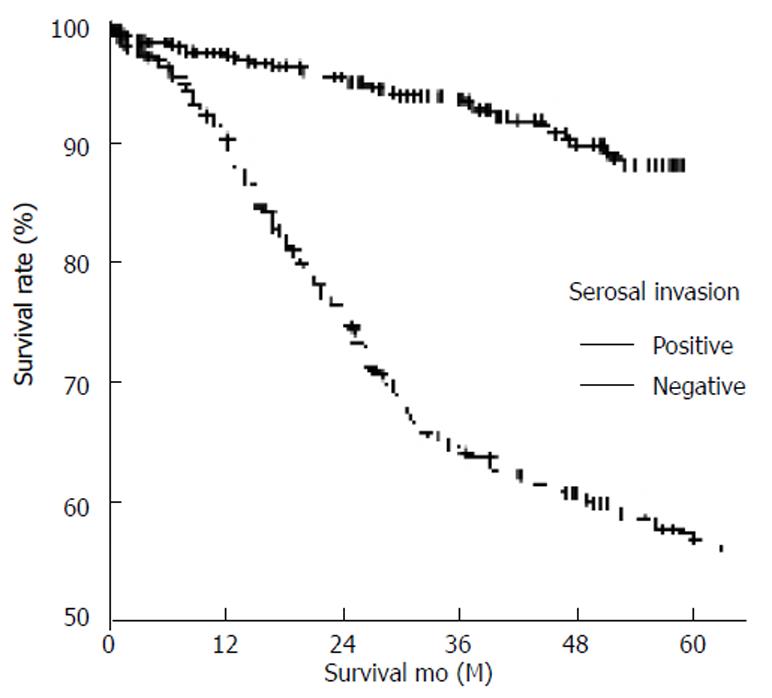
Figure 2 Survival curves of lymph node-negative gastric carcinoma according to serosal invasion (positive, 55.
4% vs negative, 88.4%) (P < 0.001).
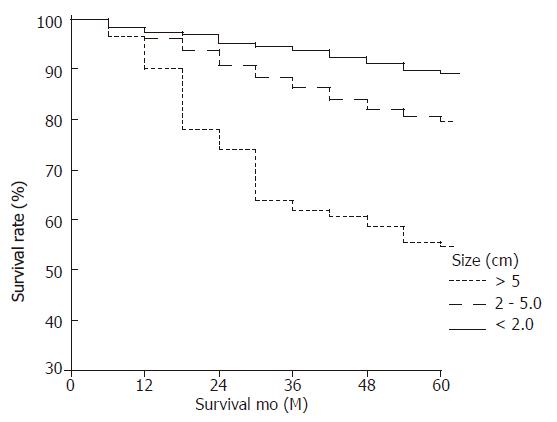
Figure 3 Survival curves of lymph node-negative gastric carcinoma according to tumor size (< 2cm, 88.
5% vs 2-5 cm, 79.2% vs ≥5 cm, 53.6%) (P < 0.001).
Figure 4 Survival curves of lymph node-negative gastric carcinoma according to curability (curative, 78.
9% vs non-curative, 17.4%) (P < 0.001).
- Citation: Kim DY, Seo KW, Joo JK, Park YK, Ryu SY, Kim HR, Kim YJ, Kim SK. Prognostic factors in patients with node-negative gastric carcinoma: A comparison with node-positive gastric carcinoma. World J Gastroenterol 2006; 12(8): 1182-1186
- URL: https://www.wjgnet.com/1007-9327/full/v12/i8/1182.htm
- DOI: https://dx.doi.org/10.3748/wjg.v12.i8.1182


