Copyright
©2006 Baishideng Publishing Group Co.
World J Gastroenterol. Feb 21, 2006; 12(7): 1018-1024
Published online Feb 21, 2006. doi: 10.3748/wjg.v12.i7.1018
Published online Feb 21, 2006. doi: 10.3748/wjg.v12.i7.1018
Figure 1 Viability (A) and LDH level (B) in control and HepG2 cells.
Cells were exposed to different concentrations of T. arjuna extract for 48 h and percentage of viable and dead cells was determined using trypan blue exclusion method. Results were expressed as the percent of total cell number and the percentage of LDH leakage was analyzed. Values are mean ± SD (n = 6). aP < 0.05 represents the statistical significance between control and T. arjuna treated HepG2 cells.
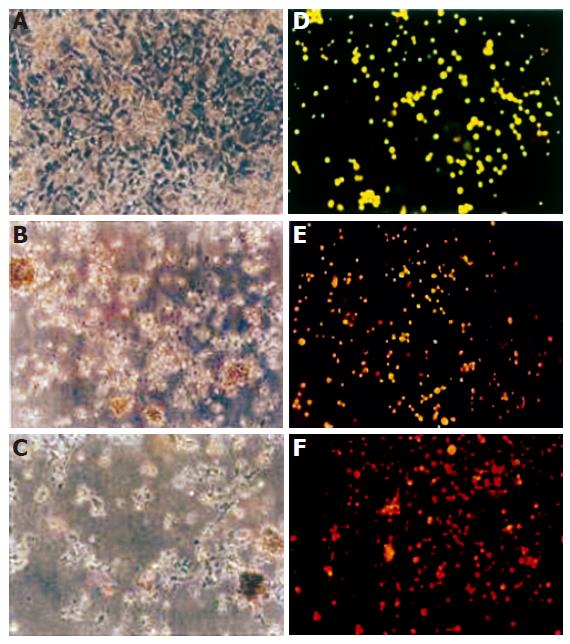
Figure 2 Morphological changes of HepG2 cells under light and fluorescence microscope.
HepG2 cells were incubated for 48 h with T. arjuna extract. The medium was removed and the cells were rinsed and visualized under light microscope in control (A), 60 mg/LL (B), 100 mg/L (C) of T. arjuna extract. Cells were stained with ethidium bromide and acridine orange and observed under fluorescence microscope in control (D), 60 mg/L (E) and 100 mg/L (F) of T. arjuna extract.
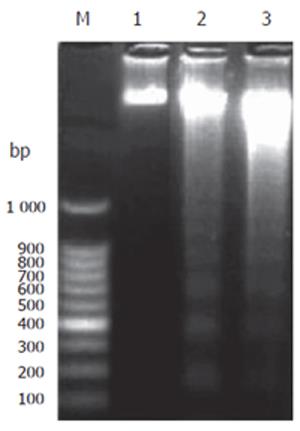
Figure 3 DNA fragmentation in HepG2 cells.
HepG2 cells were treated with T. arjuna extract and incubated for 48 h at the concentration of 60 and 100 mg/L, respectively. DNA fragmentation was carried out as described in MATERIALS AND METHODS. Lane 1: 100 bp DNA marker; Lane 2: control HepG2 cells without any treatment; Lanes 3 and 4: HepG2 cells treated with T. arjuna extract at the concentration of 60 and 100 μg/mL, respectively.
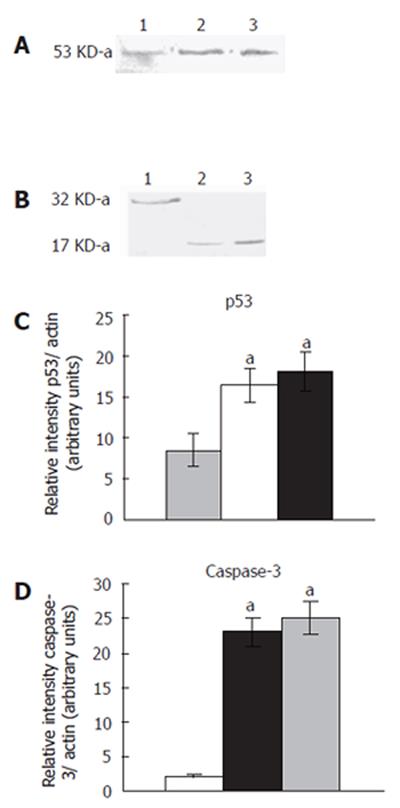
Figure 4 Expression of p53 and caspase-3 proteins.
Western blotting analysis of p53 and caspase-3 in HepG2 cells cultured for 48 h in the presence and absence of T. arjuna extract at the concentration 60 and 100 mg/L was carried out. Cell lysates were prepared as described in MATERIALS AND METHODS, and resolved by 12% SDS-PAGE, immunoblotted and detected using specific antibodies which recognized p53 (A) and caspase-3 (B). Densitometric analysis of the p53 (C) and caspase-3 band (D) was performed. Each value is mean ± SD of three observations. aP < 0.05 represents the statistical significance between control and T. arjuna extract-treated HepG2 cells.
- Citation: Sivalokanathan S, Vijayababu MR, Balasubramanian MP. Effects of Terminalia arjuna bark extract on apoptosis of human hepatoma cell line HepG2. World J Gastroenterol 2006; 12(7): 1018-1024
- URL: https://www.wjgnet.com/1007-9327/full/v12/i7/1018.htm
- DOI: https://dx.doi.org/10.3748/wjg.v12.i7.1018


