Copyright
©2006 Baishideng Publishing Group Co.
World J Gastroenterol. Feb 14, 2006; 12(6): 896-901
Published online Feb 14, 2006. doi: 10.3748/wjg.v12.i6.896
Published online Feb 14, 2006. doi: 10.3748/wjg.v12.i6.896
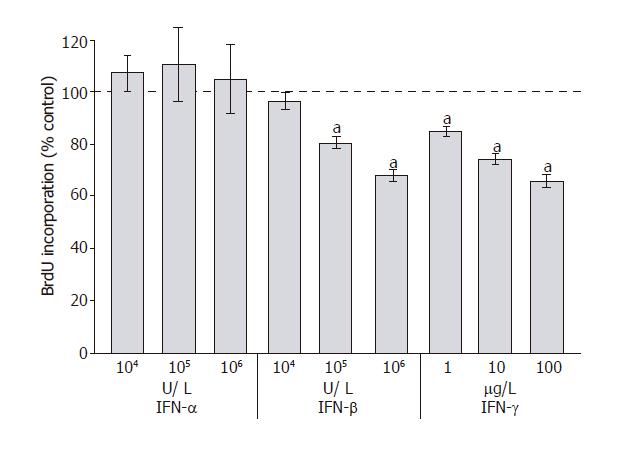
Figure 1 Effects of interferons on PSC proliferation.
PSCs growing in primary culture were harvested, replated at equal seeding densities in 96-well plates and treated with IFN-α, IFN-β and IFN-γ at the indicated concentrations for 48 h, the time when the fastest-growing cultures were almost confluent. Cell proliferation was assessed with the BrdU DNA-incorporation assay. One hundred percent cell proliferation corresponds to untreated PSCs. Data are presented as mean ± SE (n = 6 separate cell preparations from one rat). aP < 0.05 vs control cultures. The results shown are representative of three experiments using cells from different rats.
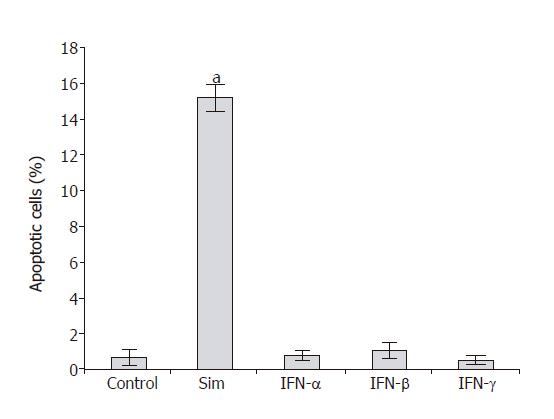
Figure 2 Effects of IFN and simvastatin on PSC survival.
PSCs growing in 12-well plates were cultured with IFN-α (106 U/L), IFN-β (106 U/L), IFN-γ (100 μg/L) and simvastatin (Sim; 5 μmol/L) as indicated. To determine the percentage of cell death by flow cytometry analysis, cells with DNA content lower than the G1 peak (sub-G1) were considered apoptotic. Data are indicated as mean ± SE (n = 6 separate cell preparations from one rat). aP < 0.05 vs control cultures. Three experiments using cells from different rats yielded qualitatively identical results.
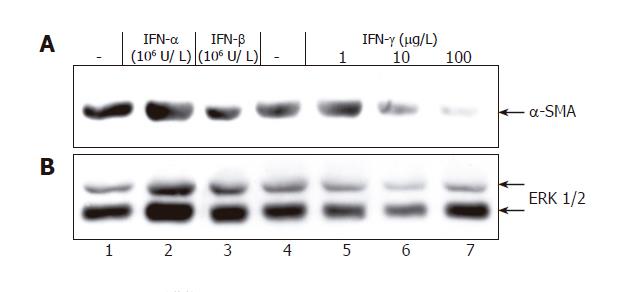
Figure 3 IFN-γ inhibits expression of α-SMA in PSCs.
Freshly isolated PSCs growing in 6-well plates were treated with IFN for 9 d as indicated. Cell lysates were normalized for protein concentration and resolved by SDS-PAGE. A: Expression of α SMA assayed by immunoblotting; B: Blot stripped and reprobed with an anti-ERK 1/2 protein-specific antibody to control loading. Results are representative of three independent experiments.
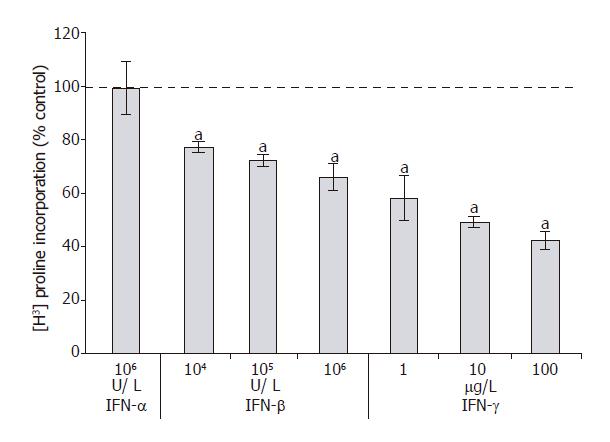
Figure 4 Effects of IFNs on [3H]-proline incorporation in PSCs.
PSCs growing in 12-well plates (one passage) were exposed for 48 h to IFNs as indicated. Collagen synthesis was analyzed through the quantification of [3H]-proline incorporation into acetic acid-soluble proteins, and raw data were normalized for differences in cell growth rates as described under “Materials and methods”. One hundred percent [3H]-proline incorporation corresponds to untreated PSCs. Data are presented as mean ± SE (n = 6 separate cell preparations from one rat). aP < 0.05 vs control cultures. The results shown are representative of three experiments using cells from different rats.
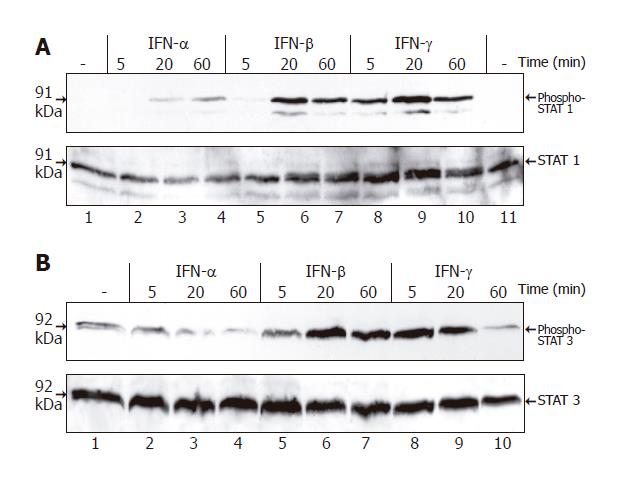
Figure 5 Tyrosine phosphorylation of STAT1 and STAT3 in PSCs induced by IFN.
PSCs growing in 6-well plates (one passage) were treated with IFN-α (106 U/L), IFN-β (106 U/L) and IFN-γ (100 μg/L) as indicated. Cell lysates were normalized for protein concentration and resolved by SDS-PAGE. A: Tyrosine phosphorylation of STAT1 assayed by immunoblotting using an antibody specific for the tyrosine-phosphorylated protein (upper panel). To control loading, the blot was stripped and reprobed with an anti-STAT1 protein-specific antibody (lower panel); B: Immunoblot analysis performed using an antibody specific for tyrosine-phosphorylated STAT3 (upper panel) and the blot stripped and reprobed with an anti-STAT3 protein-specific antibody (lower panel). Results are representative of three independent experiments.
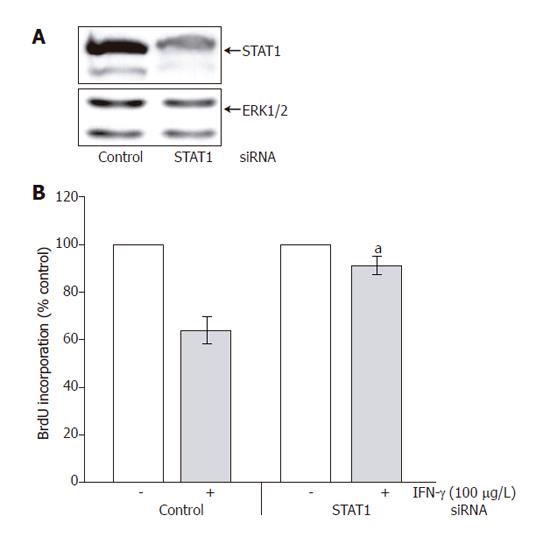
Figure 6 Effects of STAT1 siRNA on PSC growth.
A: Expression of STAT1 in PSCs 5 d after STAT1 siRNA application determined by immunoblot analysis as well as ERK 1 and 2 expression analyzed using an anti-ERK 1/2 protein-specific antibody; B: PSCs treated with STAT1 siRNA and IFN-γ as indicated and control cultures were exposed to a non-silencing control oligonucleotide at the same concentration. PSC proliferation was analyzed through the determination of BrdU incorporation into newly synthesized DNA as described in the section “Materials and methods”. One hundred percent cell proliferation corresponds to PSCs treated with control oligonucleotide (left two columns) or STAT 1 siRNA (right two columns) in the absence of IFN-γ Data are presented as mean ± SE (n = 7 separate cell preparations from one rat). aP<0.05 vs IFN-γ-treated control cultures. The results shown are representative of three experiments using cells from different rats.
- Citation: Baumert JT, Sparmann G, Emmrich J, Liebe S, Jaster R. Inhibitory effects of interferons on pancreatic stellate cell activation. World J Gastroenterol 2006; 12(6): 896-901
- URL: https://www.wjgnet.com/1007-9327/full/v12/i6/896.htm
- DOI: https://dx.doi.org/10.3748/wjg.v12.i6.896


