Copyright
©2006 Baishideng Publishing Group Co.
World J Gastroenterol. Feb 14, 2006; 12(6): 885-895
Published online Feb 14, 2006. doi: 10.3748/wjg.v12.i6.885
Published online Feb 14, 2006. doi: 10.3748/wjg.v12.i6.885
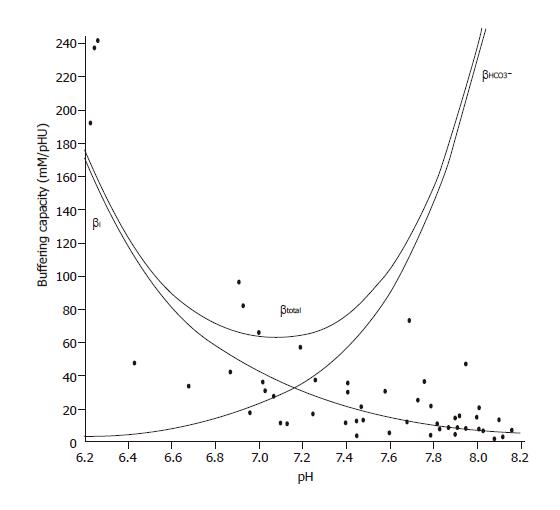
Figure 1 Buffering capacity of CFPAC-1 human pancreatic duct cells at different pHi values.
Polarized CFPAC-1 cells were exposed to varying concentrations of NH4Cl (0–30 mmol/L), while Na+ and HCO3– were omitted from the bath solution to block the Na+ and HCO3–-dependent pH regulatory mechanisms. βi was estimated by the Henderson–Hasselbalch equation (n=50). The total buffering capacity (βtotal) was calculated as βtotal=βi+βHCO3–, where βHCO3– is the buffering capacity of the HCO3–/CO2 system. βHCO3–=2.3×[HCO3–]i. [HCO3–]i is the intracellular concentration of HCO3–.
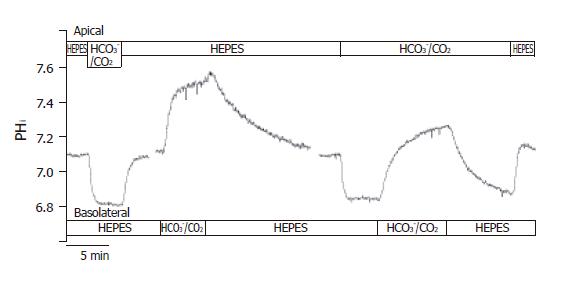
Figure 2 Functional polarities of CFPAC-1 cells.
CFPAC-1 cells were grown to confluence on permeable supports, loaded with the pH-sensitive fluorescent dye BCECF-AM (2 µmol/L) and mounted into a perfusion chamber, which allowed the simultaneous perfusion of different solutions to the basolateral and apical membranes. The figure shows representative pHi traces demonstrating cell polarity. The administration of standard HCO3–/CO2 solution to the apical and the basolateral sides of the cells showed a marked difference in response (n = 12–20).
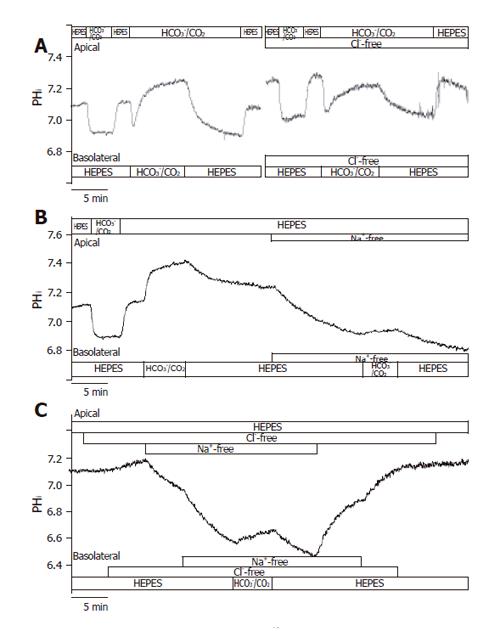
Figure 3 Basolateral HCO3– uptake – effects of Cl– and/or Na+ withdrawal.
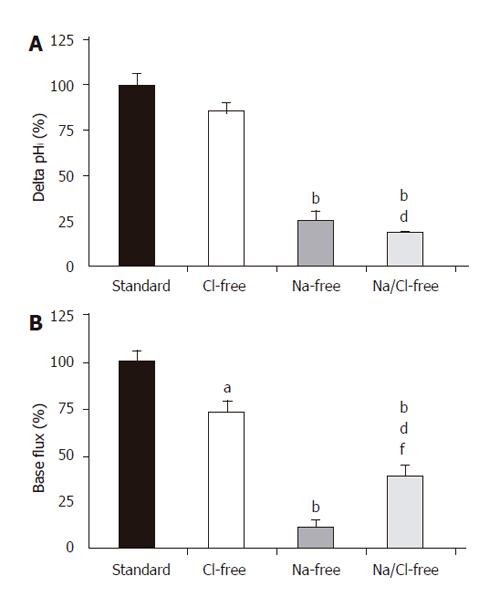
The figure shows representative pHi traces. A: The rate of HCO3– uptake was significantly decreased in Cl-free conditions compared to standard conditions (J(B) = 73.1 ± 7.2% and 100 ± 8.5%, respectively, n = 5); B: The administration of basolateral HCO3–/CO2 in Na+-free conditions (n = 6) greatly decreased ∆pHi and J(B) compared to standard conditions, suggesting that a large proportion of the HCO3– uptake was due to a Na+-sensitive process, most likely NBC; C: Interestingly, the decrease in the rate of HCO3– uptake was obviously ameliorated in the absence of both Na+ and Cl– (n = 6) compared to the Na+-free condition.
Figure 4 Basolateral HCO3– uptake – changes in (A) ∆pHi and (B) J(B) caused by the withdrawal of Cl– and/or Na+.
SE of the control groups (standard, black bar) is somewhat different for each of the respective ion-withdrawal groups. The SEs depicted on the standard bars are the maximum values observed. aP<0.05 and bP<0.01 vs control group dP<0.01 vs Cl–-free group and/or fP<0.01 vs Na+-free group.
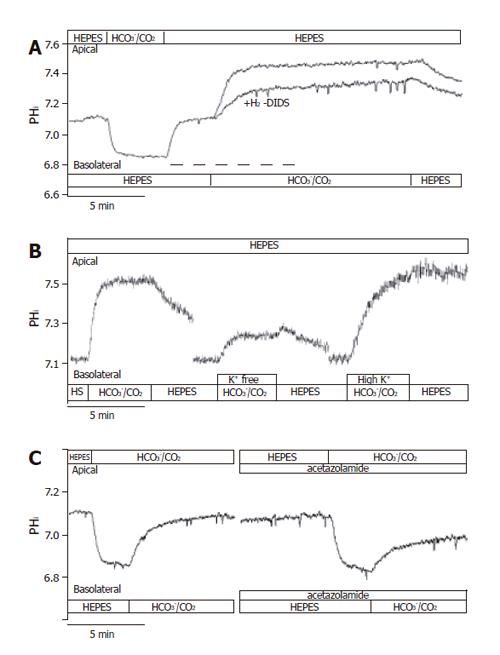
Figure 5 Basolateral HCO3– uptake – effects of H2-DIDS, acetazolamide and varying extracellular K+ concentration.
The figure shows representative pHi traces. A: The anion transport inhibitor 600 µmol/L H2-DIDS (added to the basolateral membrane of cells for 2 min before and during the administration of basolateral HCO3–/CO2, dashed line, n=6) significantly decreased the extent of alkalinization (∆pHi) and rate of J(B) (n=6); B: Varying extracellular [K+] caused significant differences in ∆pHi and J(B) (n=9–11); C: The application of the membrane-permeable carbonic anhydrase inhibitor acetazolamide (100 µmol/L, n = 6) significantly decreased the overall ∆pHi and J(B). HS: HEPES.
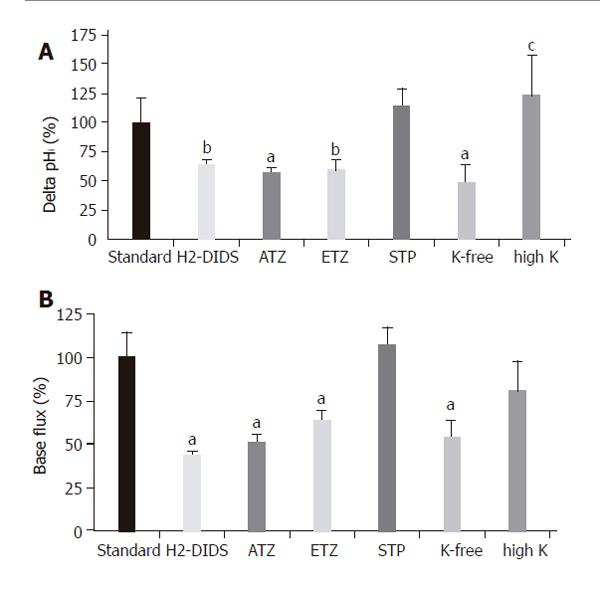
Figure 6 Basolateral HCO3– uptake – changes in (A) ∆pHi (B) J(B) caused by application of H2-DIDS, acetazolamide, ethoxyzolamide, STP and varying extracellular K+ concentration.
Data are shown as mean ± SE (n = 6–11). SE of the control groups (standard, black bar) is somewhat different for each of the respective ion-withdrawal groups. The SE depicted on the control bar was the maximum values observed. aP<0.05 and bP<0.01 vs control group or cP<0.05 vs K+-free group. ATZ: acetazolamide; ETZ: ethoxyzolamide; STP: 1-N-(4-sulfamoylphenylethyl)-2,4,6-trimethylpyridine perchlorate. The SE depicted on the standard bars was the maximum values observed.
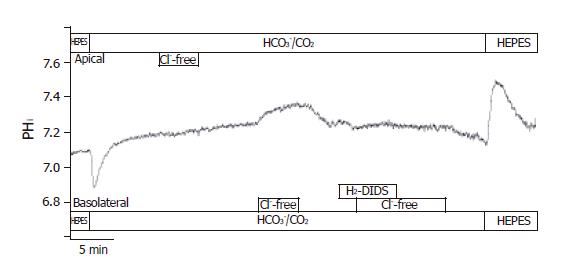
Figure 7 Localization of Cl–/HCO3– exchangers in CFPAC-1 cells.
The figure shows representative pHi traces (n = 6). The localization of Cl–/HCO3– exchangers was performed by measuring the effect of changes in Cl– gradient across the luminal or basolateral membranes on pHi. In the presence of HCO3–, the removal of Cl– from the apical membrane did not result in changes of pHi. The removal of Cl– from the basolateral membrane caused a ∆pHi of 0.08 ± 0.01 and a J(B) of 4.37 ± 0.46 mmol/L B/min. Furthermore, the basolateral administration of 250 µmol/L H2-DIDS completely blocked pHi changes caused by the withdrawal of Cl–.
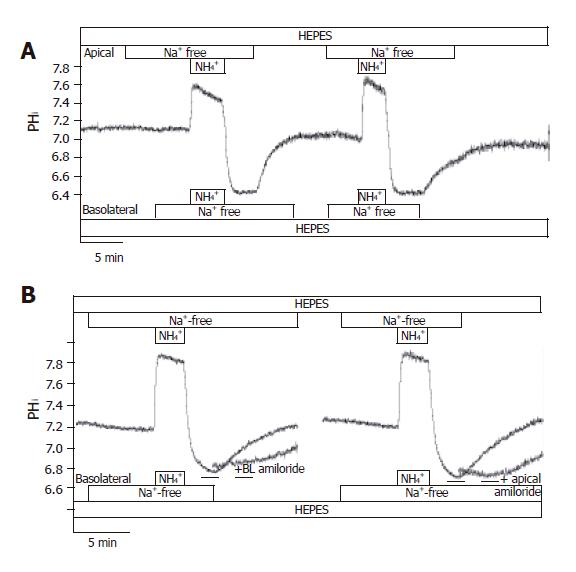
Figure 8 Localization of Na+/H+ exchangers in CFPAC-1 cells.
The figure shows representative pHi traces. A: After exposure to NH4+ in the absence of Na+ on both sides of the duct cells, pHi reduced to 6.73 ± 0.03 (n = 12), and stabilized at this level. We could not detect any active H+-pumps in CFPAC-1 cells, since pHi did not increase in the absence of extracellular Na+. Upon addition of Na+ to the apical or the basolateral side prompted the pHi to recover towards the resting values (n = 6-10); B: The administration of 300 µmol/L amiloride (dashed line) to the Na+-free (from 2 min before the addition of Na+) and Na+-containing HEPES solutions prevented the recovery of pHi in the presence of Na+ (n = 6). Removal of amiloride resulted in the recovery of pHi to resting values.
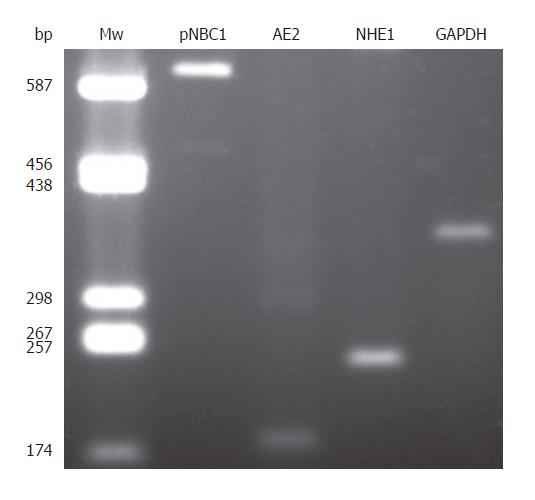
Figure 9 Expression of pNBC1, AE2, NHE1, and GAPDH mRNA in CFPAC-1 cells.
Mw: molecular weight ladder (bp indicates number of base pairs).
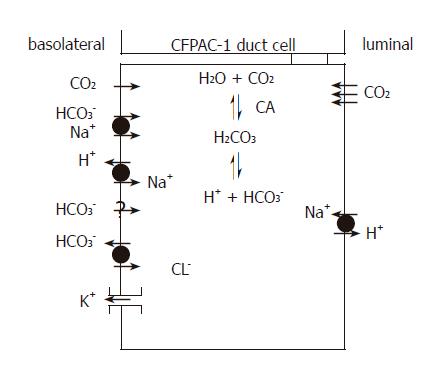
Figure 10 H+ and HCO3– transport mechanisms in CFPAC-1 human pancreatic duct cells.
The basolateral membrane expresses Na+/HCO3– co-transporters, Na+/H+ exchangers and Cl–/HCO3– exchangers plus an unidentified Na+-independent HCO3– entry pathway. These transporters facilitate the rapid flux of HCO3– ions into the cell. K+ channels are also likely to be expressed on the basolateral membrane because altering extracellular K+ concentration affects HCO3– influx. The apical membrane expresses Na+/H+ exchangers, but not CFTR and Cl–/HCO3– exchangers found in normal pancreatic duct cells. The apical membrane is an effective barrier to HCO3– influx from the lumen, but is freely permeable to CO2. CA: Carbonic anhydrase.
- Citation: Jr ZR, Fearn A, Hegyi P, Boros I, Gray MA, Argent BE. Characterization of H+ and HCO3- transporters in CFPAC-1 human pancreatic duct cells. World J Gastroenterol 2006; 12(6): 885-895
- URL: https://www.wjgnet.com/1007-9327/full/v12/i6/885.htm
- DOI: https://dx.doi.org/10.3748/wjg.v12.i6.885


