Copyright
©2006 Baishideng Publishing Group Co.
World J Gastroenterol. Feb 14, 2006; 12(6): 880-884
Published online Feb 14, 2006. doi: 10.3748/wjg.v12.i6.880
Published online Feb 14, 2006. doi: 10.3748/wjg.v12.i6.880
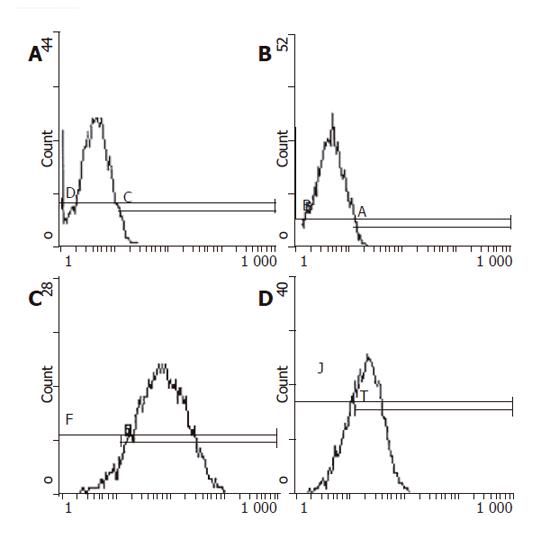
Figure 1 Flow cytometric analysis of CD80 expression in cells of different groups.
A: HepG2/mock; B: negative control; C: HepG2/hCD80; D: positive control.
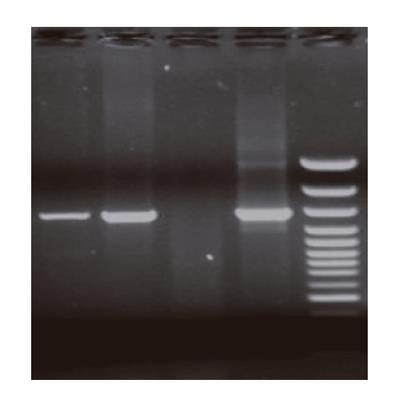
Figure 2 RT-PCR analysis of CD80 mRNA expression in different group cells.
M: DL1000 molecule marker; lane 1: β-action; lane 2: positive control; lane 3: HepG2/mock; lane 4: HepG2/hCD80 cells.
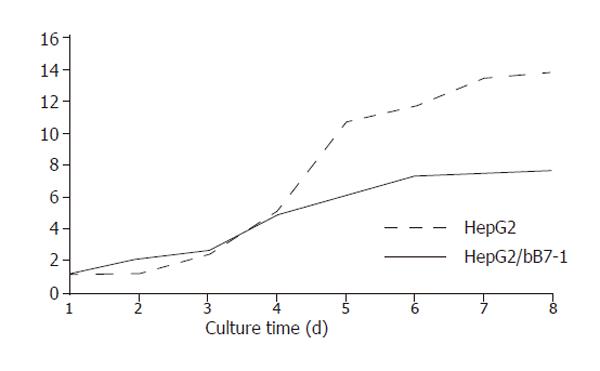
Figure 3 Curve of cell growth and time of multiple proliferation.
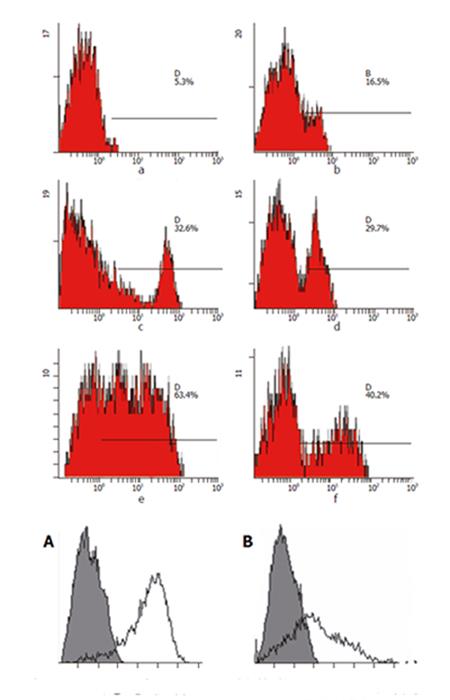
Figure 4 CD25 expression on T cells stimulated by HepG2/mock cells or HepG2/hCD80 cells.
A: T cells stimulated by HepG2/hCD80 cells; B: T cells stimulated by HepG2/mock cells. Shaded histograms show reactivity with the isotype control. Each figure is representative of at least three experiments.
- Citation: Li DC, Zhu XG, Zhang Y, Fu JX. Role of CD80 in stimulating T lymphocyte activation. World J Gastroenterol 2006; 12(6): 880-884
- URL: https://www.wjgnet.com/1007-9327/full/v12/i6/880.htm
- DOI: https://dx.doi.org/10.3748/wjg.v12.i6.880


