Copyright
©2006 Baishideng Publishing Group Co.
World J Gastroenterol. Feb 14, 2006; 12(6): 858-867
Published online Feb 14, 2006. doi: 10.3748/wjg.v12.i6.858
Published online Feb 14, 2006. doi: 10.3748/wjg.v12.i6.858
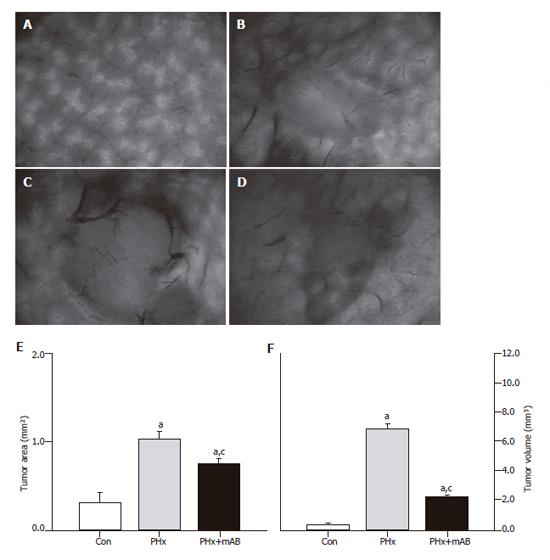
Figure 1 Intravital fluorescence microscopy at d 7 after tumor cell implantation.
A: Displays the normal liver microvasculature; B: shows the microvasculature of the tumor of a non-resected control animal (Con); C: displays a 7-day tumor and its microvasculature of an animal which underwent hepatectomy (PHx); D: shows the tumor microvasculature after additional anti-MIP-2 treatment (PHx+mAB). Quantitative analysis of tumor area (E) and tumor volume (F) showed that hepatectomy (PHx) markedly accelerated tumor growth when compared with controls (Con), and that additional anti-MIP-2 treatment (PHx+mAB) was capable of significantly reducing this liver resection-induced tumor growth. Mean ± SE; aP < 0.05 vs Con; cP < 0.05 vs PHx. Magnifications (A-D) ×16.
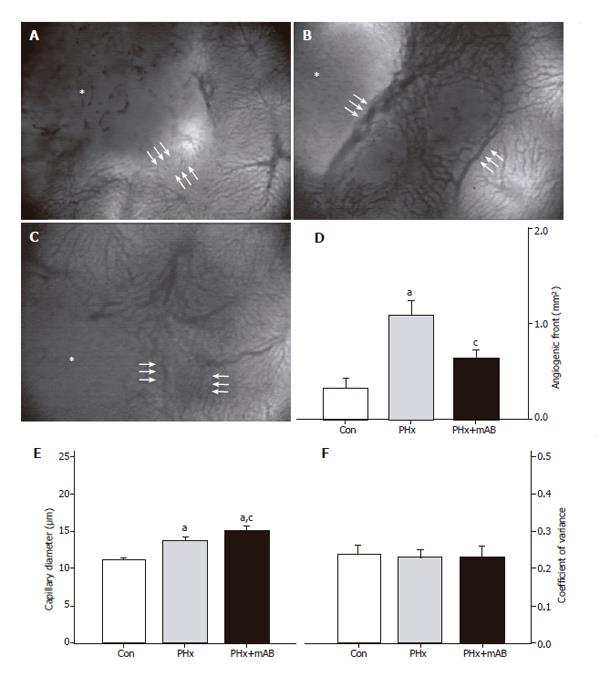
Figure 2 Analysis of the size of the angiogenic front (area between the triple arrows) at the margin of tumors (asterisks) in control mice (A, Con), after hepatectomy (B, PHx) and after hepatectomy and additional anti-MIP-2 treatment (C, PHx+mAB).
Quantitative analysis of the area of the angiogenic front (D) indicated a significant increase after hepatectomy (PHx) when compared with that of controls (Con). Additional anti-MIP-2 treatment (PHx+mAB) was capable of reducing the angiogenic process. Further, hepatectomy (PHx) significantly increased capillary dilation within the angiogenic front (E) compared to controls (Con), which was even more pronounced after additional anti-MIP-2 treatment (PHx+mAB). The heterogeneity of capillary diameters, as given by the coefficient of variance, was not affected in either of the treatment groups (F). Mean ± SE; aP < 0.05 vs Con; cP < 0.05 vs PHx. Magnifications (A-C) ×40.
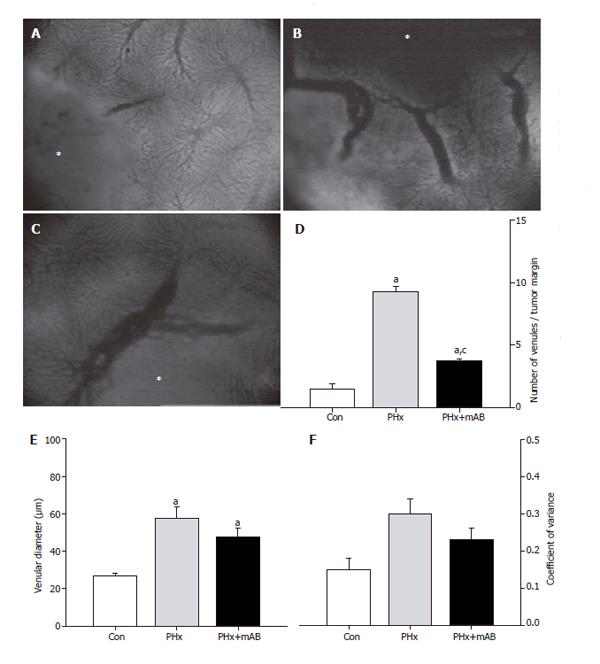
Figure 3 Analysis of the number of venules within the margin of tumors (A-C, asterisk) of control mice (A, Con), after hepatectomy (B, PHx) and after hepatectomy and additional anti-MIP-2 treatment (C, PHx+mAB).
Quantitative analysis showed that hepatectomy significantly increases the number of venules (D), and causes a marked dilation of the draining venules within the margin of the tumors (E). Additional anti-MIP-2 treatment was capable of significantly reducing the liver resection-induced increase of the number of tumor venules (D). The heterogeneity of venular diameters, as given by the coefficient of variance, was not affected in either of the treatment groups (F). Mean ± SE; aP < 0.05 vs Con; cP < 0.05 vs PHx. Magnifications (A-C) ×40.
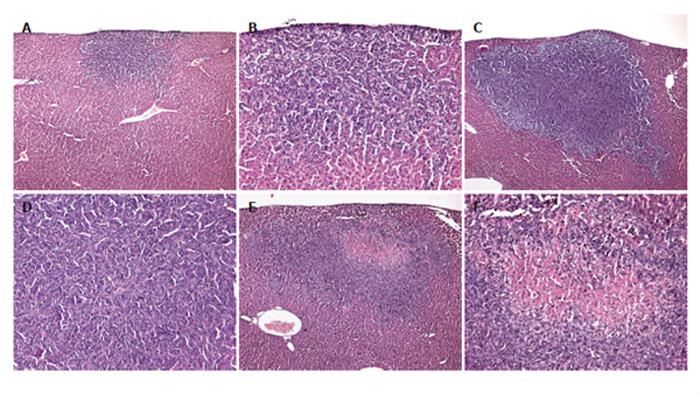
Figure 4 Hematoxylin–eosin-staining of tumors of a control mouse (A and B), a mouse which underwent hepatectomy (PHx) (C and D), and a mouse which additionally received anti-MIP-2 treatment (E and F).
Sections revealed solid growth of the colorectal CT26.WT hepatic metastasis in all the animals. Tumors were round in nature, however, showed aggressive growth characteristics. Anti-MIP-2 treatment provoked an area of necrosis within the tumor center (E and F). Magnifications (A, C and E) ×18, (B, D and F) ×88.
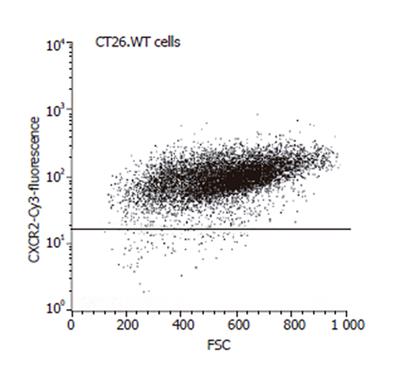
Figure 5 FACScan analysis of CT26.
WT cells, demonstrating positive staining and thus expression of the chemokine receptor CXCR-2 by almost all of the tumors cells studied.
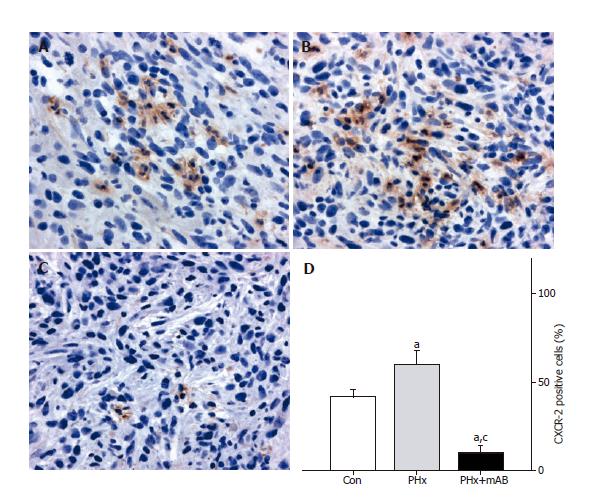
Figure 6 CXCR-2 immunohistochemistry and quantitative analysis of the number of receptor-positive cells (given in percent of all cells) revealed that within tumors of control animals (Con) ~40% of the cells express CXCR-2 (A and D).
Hepatectomy (PHx) significantly increased CXCR-2 expression to ~60% (B and D). Of interest, additional blockade of MIP-2 (PHx+mAB) significantly reduced tumor cell CXCR-2 expression and inhibits significantly the liver resection-induced increase of CXCR-2 expression (C and D). Mean ± SE; aP < 0.05 vs Con; cP < 0.05 vs PHx. Magnifications (A-C) ×175.
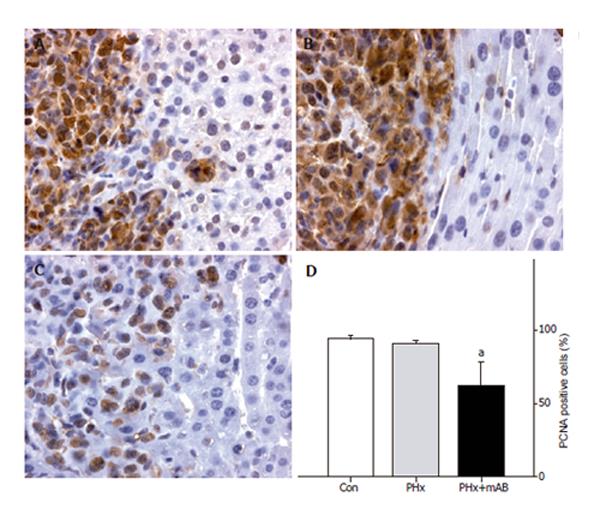
Figure 7 PCNA immunohistochemistry and quantitative analysis of the number of PCNA-positive cells (given in percent of all cells) in liver tumors of control mice (A, Con), after hepatectomy (B, PHx), and after hepatectomy and additional anti-MIP-2 treatment (C, PHx+mAB).
Tumor cells display massive PCNA staining, in particular to those located within the tumor margin. By this, these positive cells sharply demarcate the tumor from the surrounding liver tissue (A, B, and C). Quantitative analysis revealed that neutralization of MIP-2 significantly reduces the number of PCNA-positive tumor cells (D). Mean ± SE; aP < 0.05 vs Con. Magnifications (A-C) ×175.
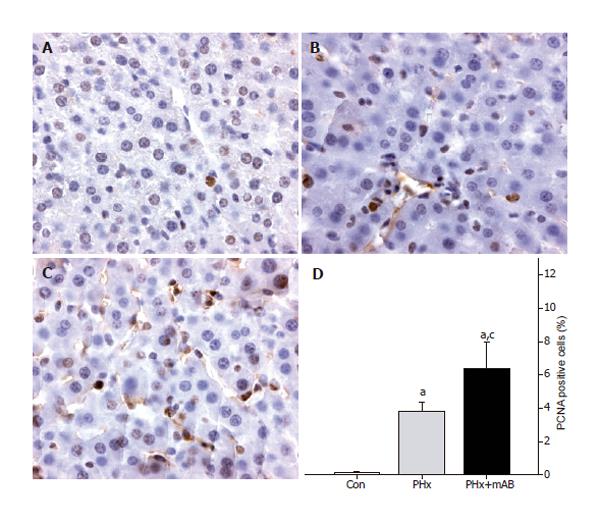
Figure 8 PCNA immunohistochemistry of normal liver tissue of control mice (A, Con), after hepatectomy (B, PHx), and after hepatectomy and additional anti-MIP-2 treatment (C, PHx+mAB).
Quantitative analysis revealed that hepatectomy increases the number of PCNA-positive stained cells when compared to controls (D). Additional neutralization of MIP-2 further enhanced the number of PCNA-positive cells (D). Mean ± SE; aP < 0.05 vs Con; cP < 0.05 vs PHx. Magnifications (A-C) ×175.
- Citation: Kollmar O, Menger MD, Schilling MK. Macrophage inflammatory protein-2 contributes to liver resection-induced acceleration of hepatic metastatic tumor growth. World J Gastroenterol 2006; 12(6): 858-867
- URL: https://www.wjgnet.com/1007-9327/full/v12/i6/858.htm
- DOI: https://dx.doi.org/10.3748/wjg.v12.i6.858


