Copyright
©2006 Baishideng Publishing Group Co.
World J Gastroenterol. Feb 7, 2006; 12(5): 703-708
Published online Feb 7, 2006. doi: 10.3748/wjg.v12.i5.703
Published online Feb 7, 2006. doi: 10.3748/wjg.v12.i5.703
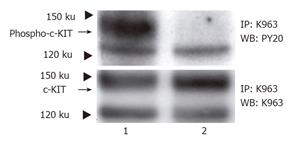
Figure 1 4×10⁶ of GIST-T1 cells were treated with STI571 (1 μg/mL) for 1 h.
Treated cells were lysed in RIPA buffer and immunoprecipitation with anti-c-KIT antibody as described in “Materials and methods”. Western blotting was performed using anti-phosphotyrosine antibody (upper panel) or anti-c-KIT antibody (lower panel). Lane 1, non-treated; lane 2, STI571 1 μg/mL. WB, Western blot; IP, immunoprecipitation.
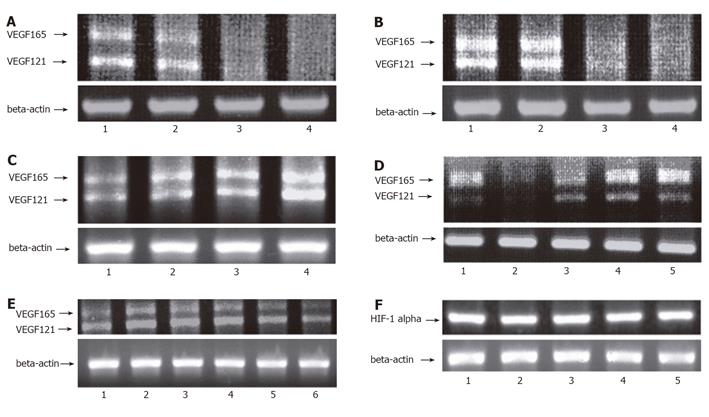
Figure 2 RT-PCR, 1×10⁶ GIST-T1 cells were treated with STI571 (0.
01, 0.1, and 1 μg/mL) for 6 h (A) or 1 μg/mL of STI571 for 60, 120, and 360 min (B). A: Lane 1, non-treated; lane 2, 0.01 μg/mL; lane 3, 0.1 μg/mL; lane 4, 1 μg/mL; B: lane 1, 0 min; lane 2, 60 min; lane 3, 120 min; lane 4, 360 min. GIST-T1 cells were treated with SCF (10 ng/mL) for 1, 2, 6 h (C). C: lane 1, 0 h; lane 2, 1 h; lane 3, 2 h; lane 4, 6 h. GIST-T1 cells were treated with STI571 (1 μg/mL), LY294002 (50 μmol/L), PD98059 (50 μmol/L), or Wortmannin (100 nmol/L) for 6 h (D). D: Lane 1, non-treated; lane 2, STI571; lane 3, LY294002; lane 4, PD98059; lane 5, Wortmannin. 1×10⁶ DLD-1 cells were treated with SCF in different concentrations for 6 h (E). E: Lane 1, non-treated; lane 2, SCF 5 ng/mL; lane 3, SCF 10 ng/mL; lane 4, SCF 15 ng/mL; lane 5, SCF 20 ng/mL; lane 6, SCF 100 ng/mL. GIST-T1 cells were treated with STI571, SCF, or combination of both for 6 h to determine the transcriptional level of HIF-1 alpha (F). F: Lane 1, non-treated; lane 2, STI571 1 μg/mL; lane 3, SCF 10 ng/mL; lane 4, SCF 10 ng/mL+STI571 1 μg/mL; lane 5, SCF 10 ng/mL+STI571 10 μg/mL.
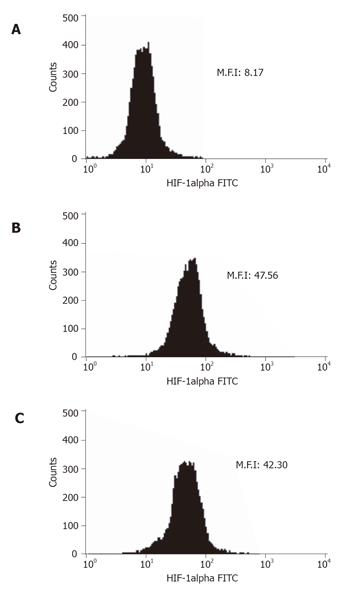
Figure 3 Expression of HIF-1 alpha was determined by flow cytometry.
2 × 10⁶ GIST-T1 cells were treated with/without STI571 as described in “Materials and the methods. A: Control (normal rabbit IgG); B: non-treated (HIF-1 alpha antibody); C: STI571 (1 μg/mL). MFI, mean fluorescent intensity.
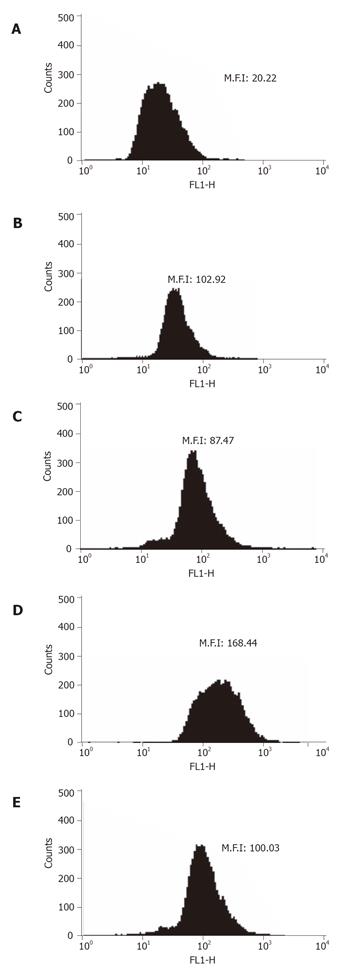
Figure 4 Expression of VEGF determined by flow cytometry.
2×10⁶ GIST-T1 cells were treated with/without STI571 or SCF as described in “Materials and methods”. A: Control (normal rabbit IgG); B: non-treated (VEGF antibody); C: STI571 (1 μg/mL); D: SCF (10 ng/mL); E: SCF (10 ng/mL)+STI571 (1 μg/mL). MFI, mean fluorescent intensity.
Figure 5 Assessment of expression of VEGF by Western blotting.
3×10⁶ cells were treated with STI571 (0.01, 0.1, and 1 μg/mL) for 12 h, and then cells were rinsed with ice-cold PBS and lysed in RIPA buffer as described in “Materials and methods”. Fifty micrograms of protein was applied in each lane. Lane 1: non-treated; lane 2: STI571 0.01 μg/mL; lane 3: STI571 0.1 μg/mL; lane 4: STI571 1 μg/mL.
- Citation: Jin T, Nakatani H, Taguchi T, Nakano T, Okabayashi T, Sugimoto T, Kobayashi M, Araki K. STI571 (Glivec) suppresses the expression of vascular endothelial growth factor in the gastrointestinal stromal tumor cell line, GIST-T1. World J Gastroenterol 2006; 12(5): 703-708
- URL: https://www.wjgnet.com/1007-9327/full/v12/i5/703.htm
- DOI: https://dx.doi.org/10.3748/wjg.v12.i5.703


