Copyright
©2006 Baishideng Publishing Group Co.
World J Gastroenterol. Feb 7, 2006; 12(5): 697-702
Published online Feb 7, 2006. doi: 10.3748/wjg.v12.i5.697
Published online Feb 7, 2006. doi: 10.3748/wjg.v12.i5.697
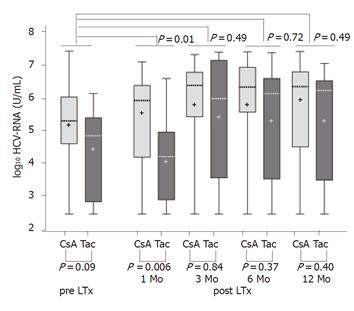
Figure 1 Box–whisker's plot of log10-transformed HCV-RNA concentrations in dependence on group (immunosuppression) and time.
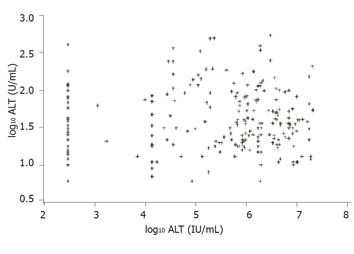
Figure 2 Correlation of HCV-RNA level in serum with ALT activity.
Scatter plot with HCV-RNA concentrations on the y-axis and ALT activity on the x-axis, both on log10-scale.
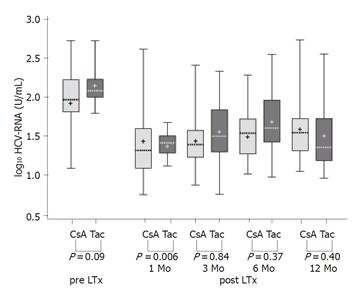
Figure 3 Box–whisker's plot of log10-transformed ALT activities in dependence on group (immunosuppression) and time.
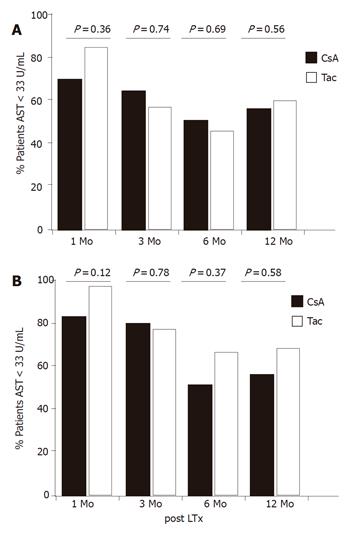
Figure 4 Proportion of HCV-infected patients under CsA or Tac medication with normal transaminase activities at different time points post LTx.
A: Percentage of patients with normal ALT; B: percentage of patients with normal and AST. P-values were calculated by x2 test.
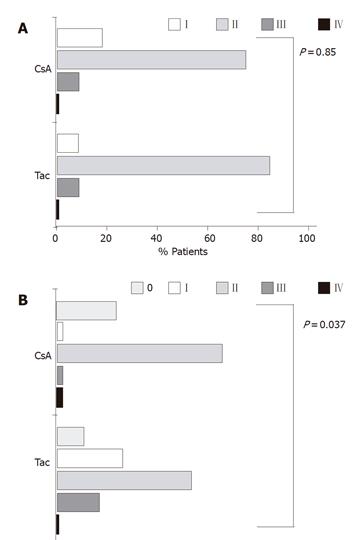
Figure 5 Intrahepatic inflammatory activity and fibrosis post LTx depending on immunosuppression.
A: Necroinflammatory activity histologically scored by the subscores for portal inflammation of the Knodell’s hepatic activity index (HAI); B: grade of fibrosis in the graft. Fibrosis was scored according to the appropriate subscores of the HAI.
-
Citation: Hilgard P, Kahraman A, Lehmann N, Seltmann C, Beckebaum S, Ross RS, Baba HA, Malago M, Broelsch CE, Gerken G. Cyclosporine
versus tacrolimus in patients with HCV infection after liver transplantation: Effects on virus replication and recurrent hepatitis. World J Gastroenterol 2006; 12(5): 697-702 - URL: https://www.wjgnet.com/1007-9327/full/v12/i5/697.htm
- DOI: https://dx.doi.org/10.3748/wjg.v12.i5.697


