Copyright
©2006 Baishideng Publishing Group Co.
World J Gastroenterol. Feb 7, 2006; 12(5): 691-696
Published online Feb 7, 2006. doi: 10.3748/wjg.v12.i5.691
Published online Feb 7, 2006. doi: 10.3748/wjg.v12.i5.691
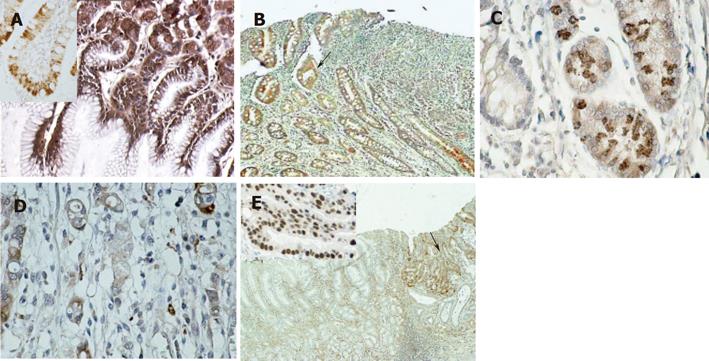
Figure 1 Immunohis-tochemical analysis of TP53INP1 expression in gastric carcinoma.
A: TP53INP1 was strongly expressed in normal gastric mucosa or intestinal metaplasia foci (inset); B: TP53INP1 expression decreased in gastric carcinoma (arrow); C: well differentiated tubular carcinoma exhibited moderate alteration of TP53INP1 expression; D: poorly differentiated carcinoma showed weak staining with TP53INP1 antibody; E: P53 expression increased in gastric carcinoma (arrow).
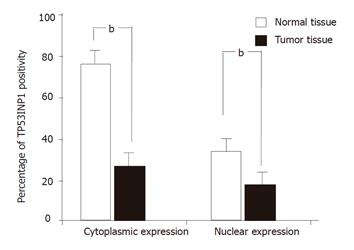
Figure 2 Comparison of TP53INP1 expression (in cell cytoplasm and nucleus) between normal gastric mucosa and gastric cancer tissues (bP < 0.
0001).
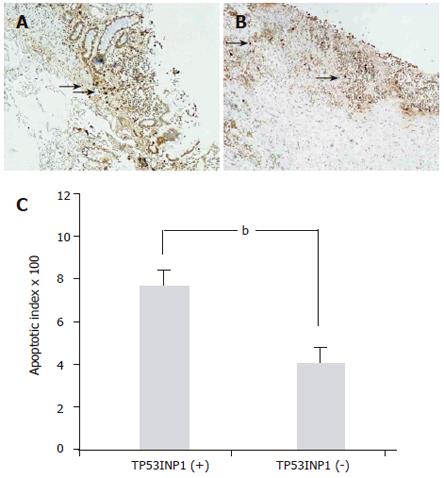
Figure 3 Apoptosis analysis in gastric cancer.
A and B: Representative patterns of TP53INP1-positive (A) and negative (B) carcinoma in TUNEL staining. Arrows indicate TUNEL-positive nuclei (original magnification ×20); C: Statistical analysis of apoptotic index in TP53INP1-positive and -negative cancer tissues (bP < 0.0001, positive vs negative).
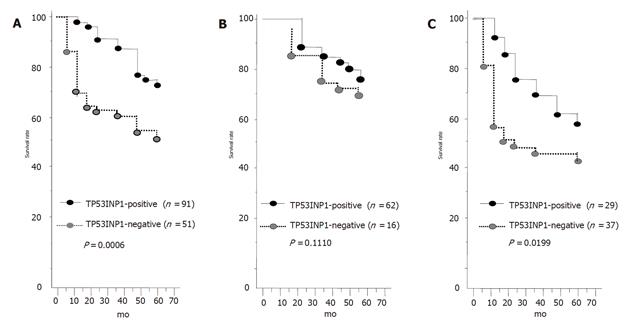
Figure 4 TP53INP1 expression and patient survival by Kaplan-Meier analysis.
A: Survival curves for TP53INP1-positive and negative gastric cancers. The 60-mo survival rates were 74.7% and 54.9%, respectively. The difference between the values was highly significant (P = 0.0006). B: In well or moderately differentiated adenocarcinoma (intestinal-type), the survival of TP53INP1-positive patients was not significantly different from that of TP53INP1-negative group (P = 0.1110). C: In poorly differentiated adenocarcinoma (diffuse-type), the 60-mo patient survival rates were 62.1% and 45.9% for TP53INP1-positive and -negative gastric cancers, respectively. This difference was statistically significant (P = 0.0199).
- Citation: Jiang PH, Motoo Y, Garcia S, Iovanna JL, Pébusque MJ, Sawabu N. Down-expression of tumor protein p53-induced nuclear protein 1 in human gastric cancer. World J Gastroenterol 2006; 12(5): 691-696
- URL: https://www.wjgnet.com/1007-9327/full/v12/i5/691.htm
- DOI: https://dx.doi.org/10.3748/wjg.v12.i5.691


